Exercise 03 - Track AI Consumption with Azure Monitoring
Introduction
Monitoring your AI consumption is critical for managing costs and ensuring fair resource allocation across your applications. By tracking token usage through Azure API Management policies and Application Insights, you gain visibility into how your AI services are being consumed, enabling you to make informed decisions about optimization and cost management.
Description
In this exercise, you will configure monitoring policies in Azure API Management to track token consumption for your Azure OpenAI endpoints. You will enable Application Insights integration, configure token tracking dimensions, and test the monitoring setup by viewing real-time metrics in the Azure portal.
Success Criteria
- You have enabled monitoring policies on your Azure OpenAI API in API Management.
- You have configured token tracking dimensions (prompt tokens, completion tokens, total tokens).
- You have successfully tested the API and viewed token consumption metrics in Application Insights.
Learning Resources
Key Tasks
01: Enable monitoring on the Azure OpenAI API
Now that you have imported your Azure OpenAI instance into API Management (from the previous exercise), you need to enable monitoring to track token consumption.
Expand this section to view the solution
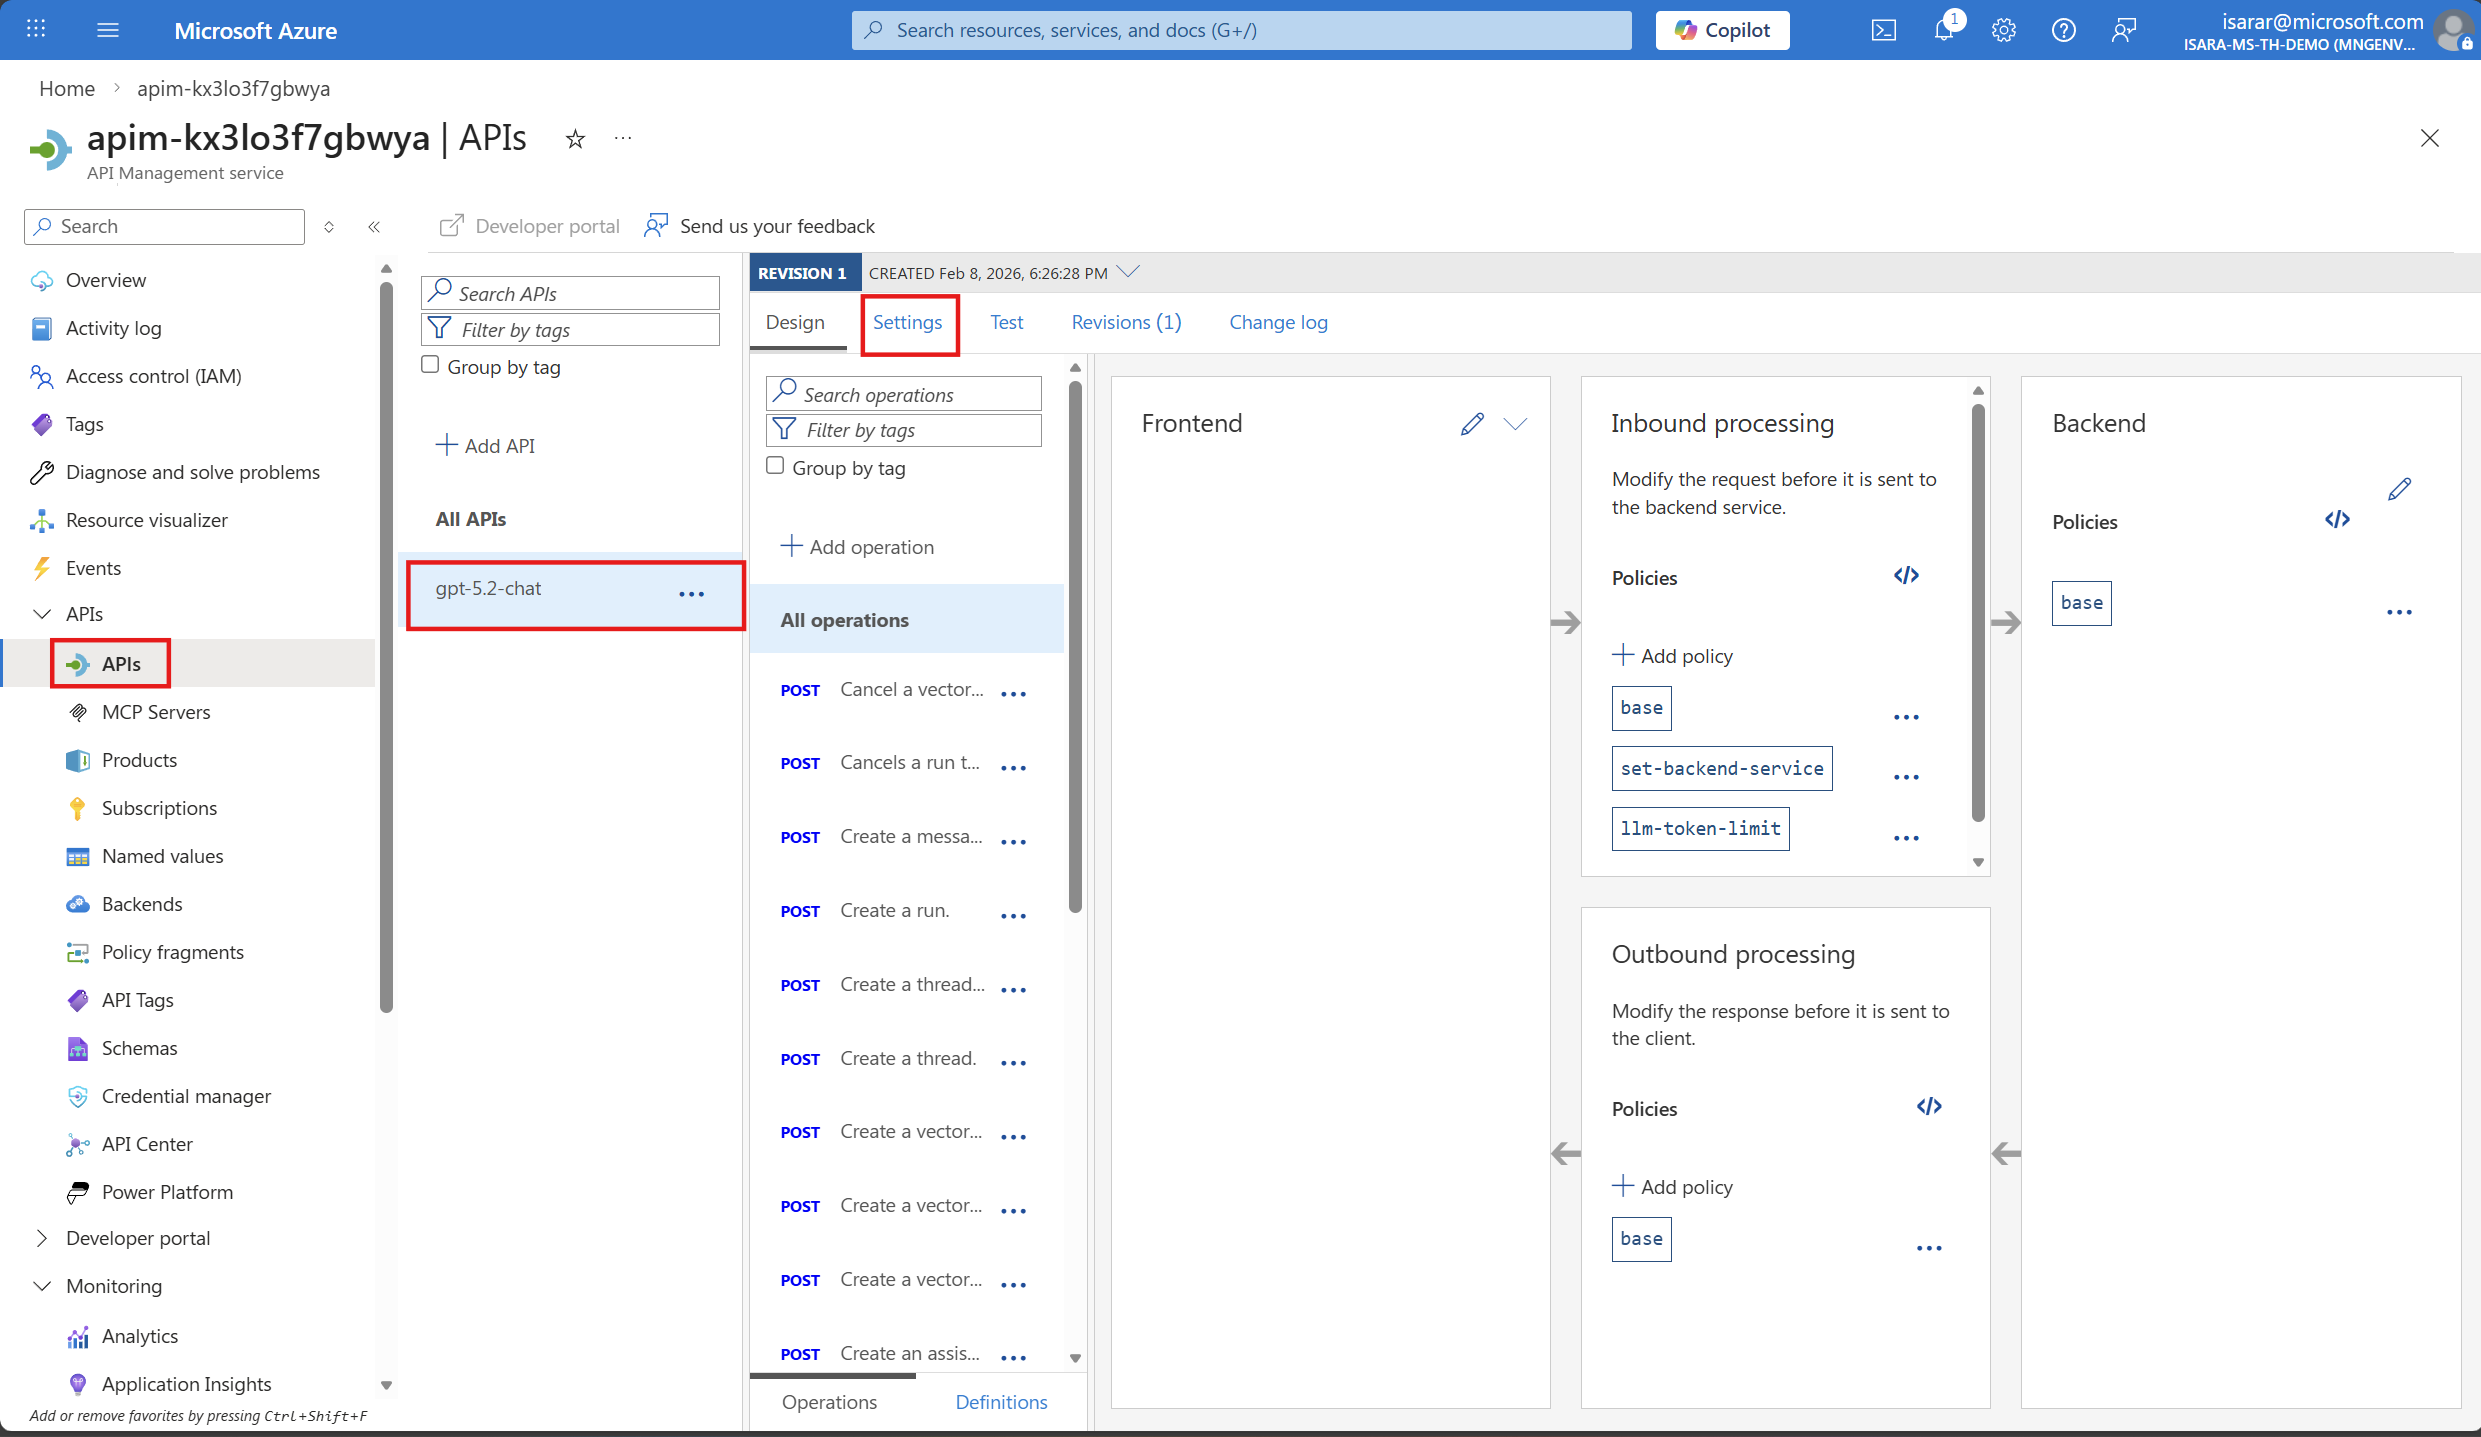
- Navigate to the Azure portal and open your API Management instance.
- In the left menu, under APIs, select APIs.
- Select your Azure OpenAI API (e.g., gpt-5.2-chat or the name you used during import).
- Select the Settings tab.
- Scroll down to the Application Insights section.
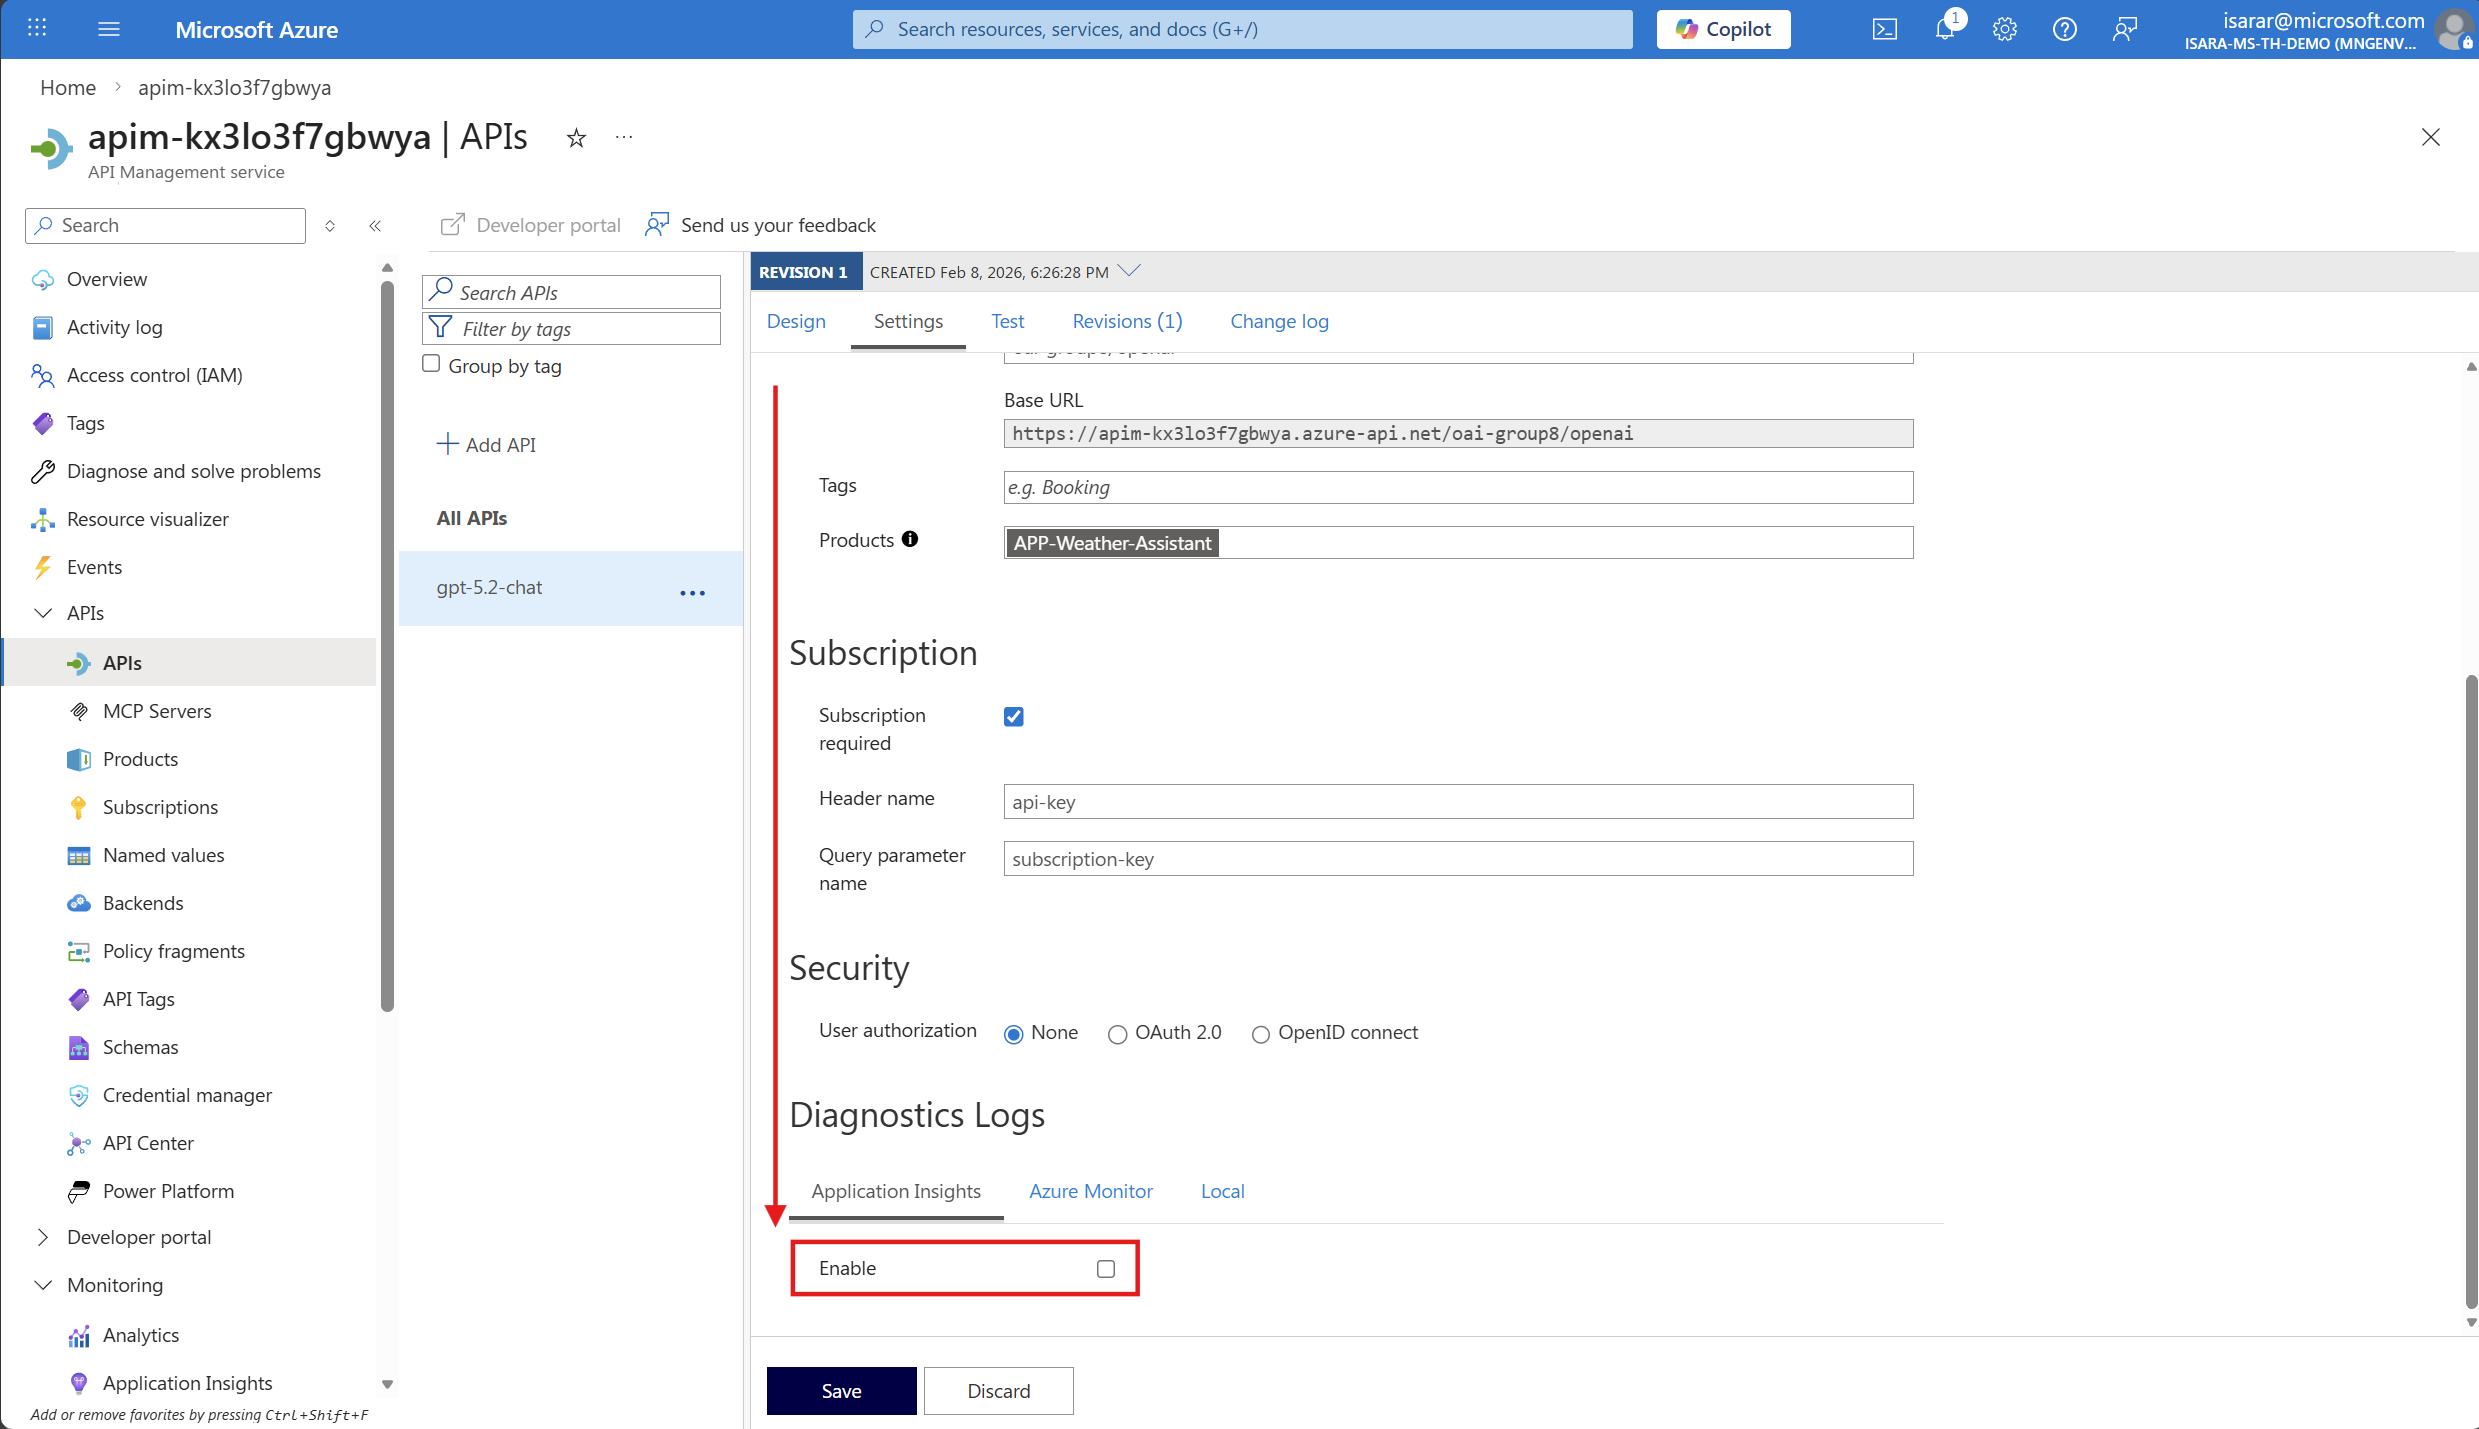
- Check the Enable checkbox to enable Application Insights integration.
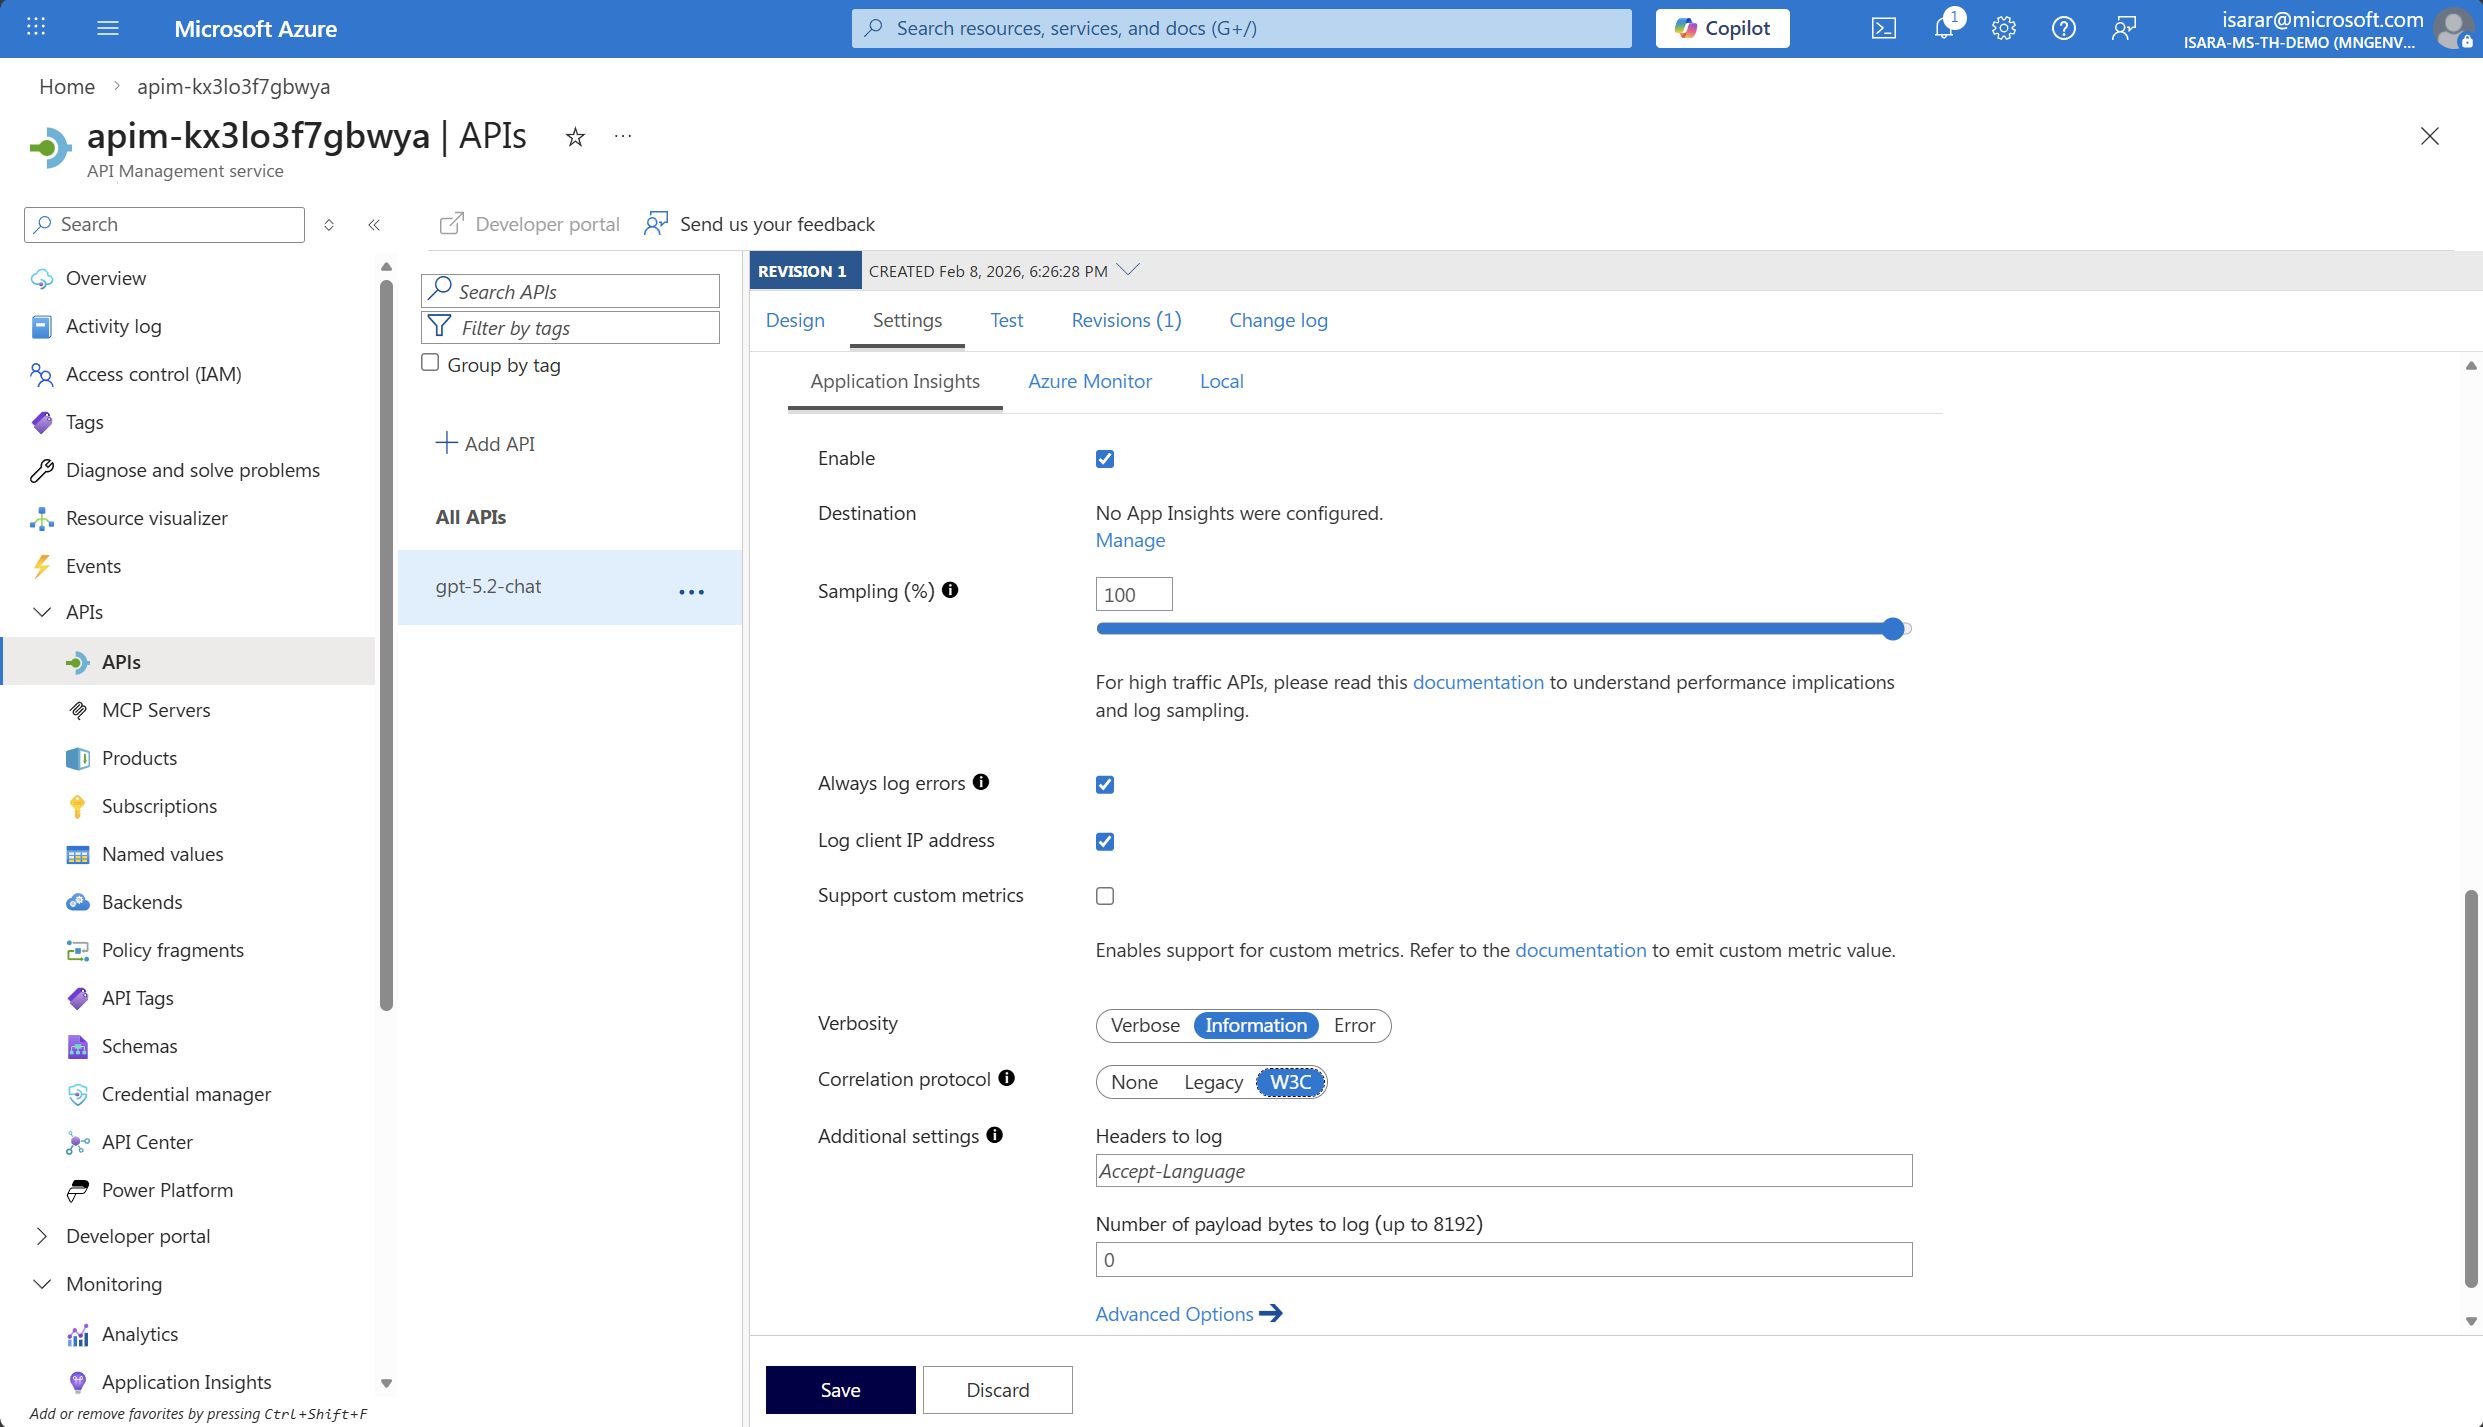
- Select your Application Insights instance from the dropdown (it should have been created during the deployment). click on Manage
 CLick Add
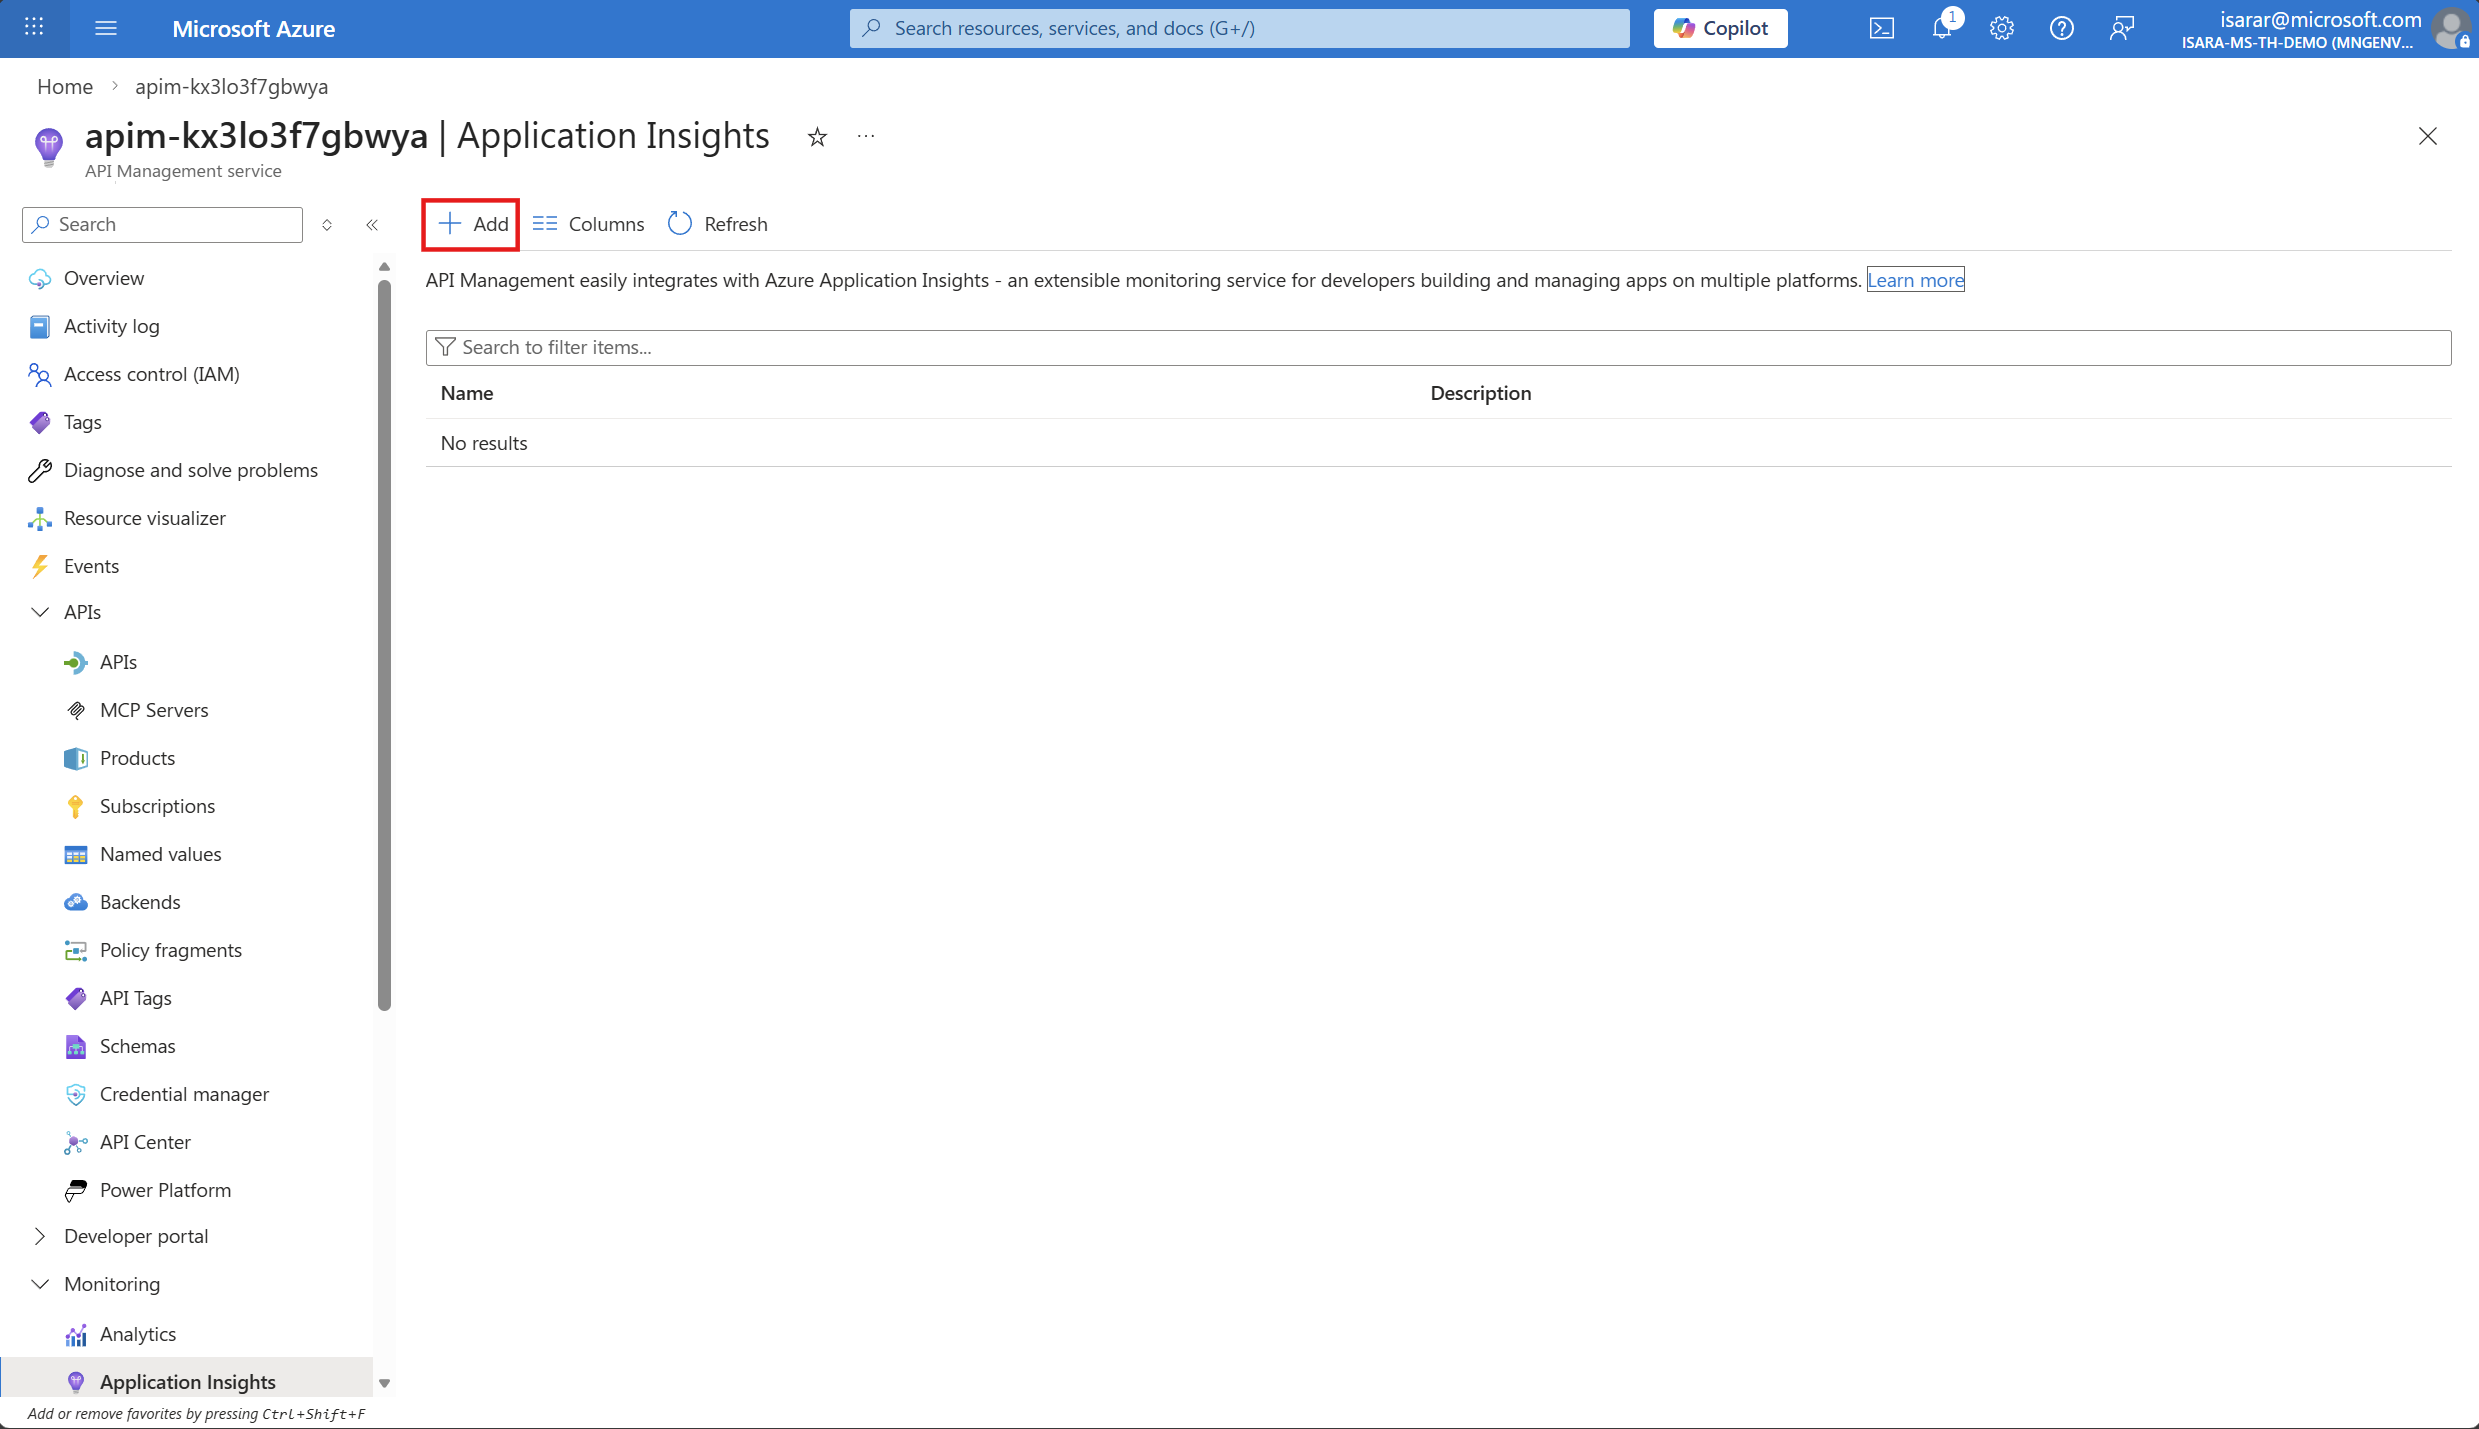
- Leave other settings as default.
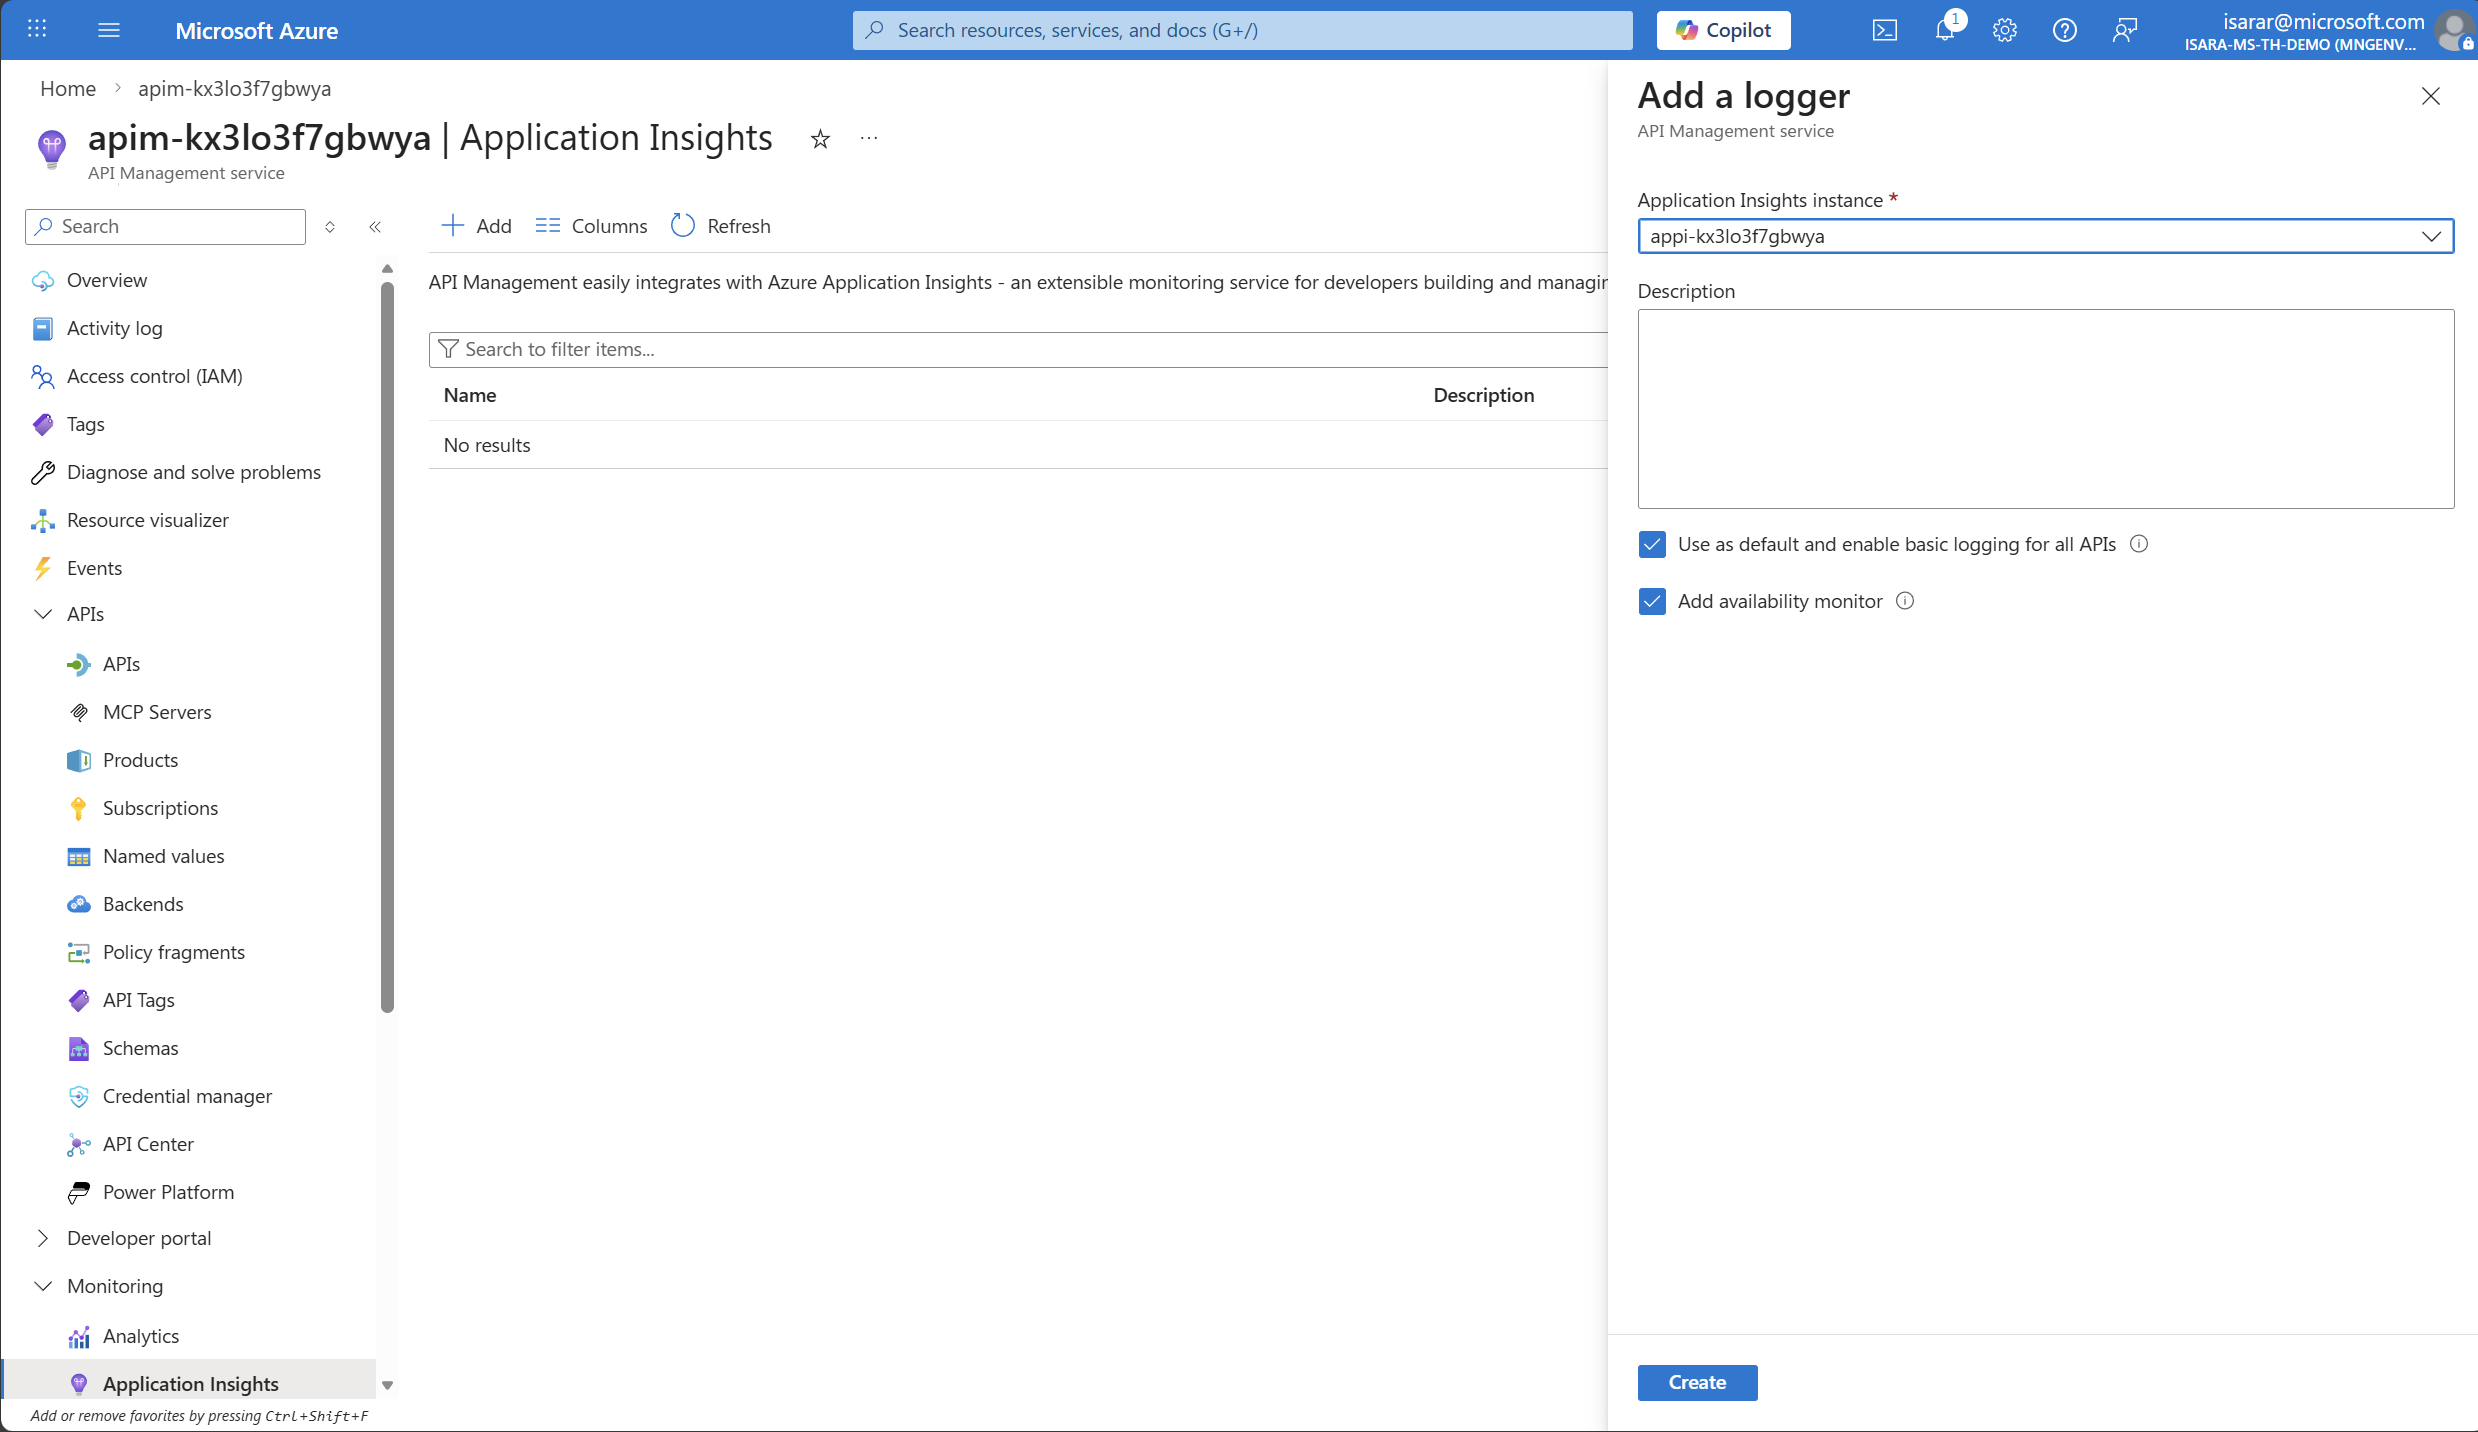
- Select Create to create logger the changes.
- Go back to API page. Add Application Insight in Destination
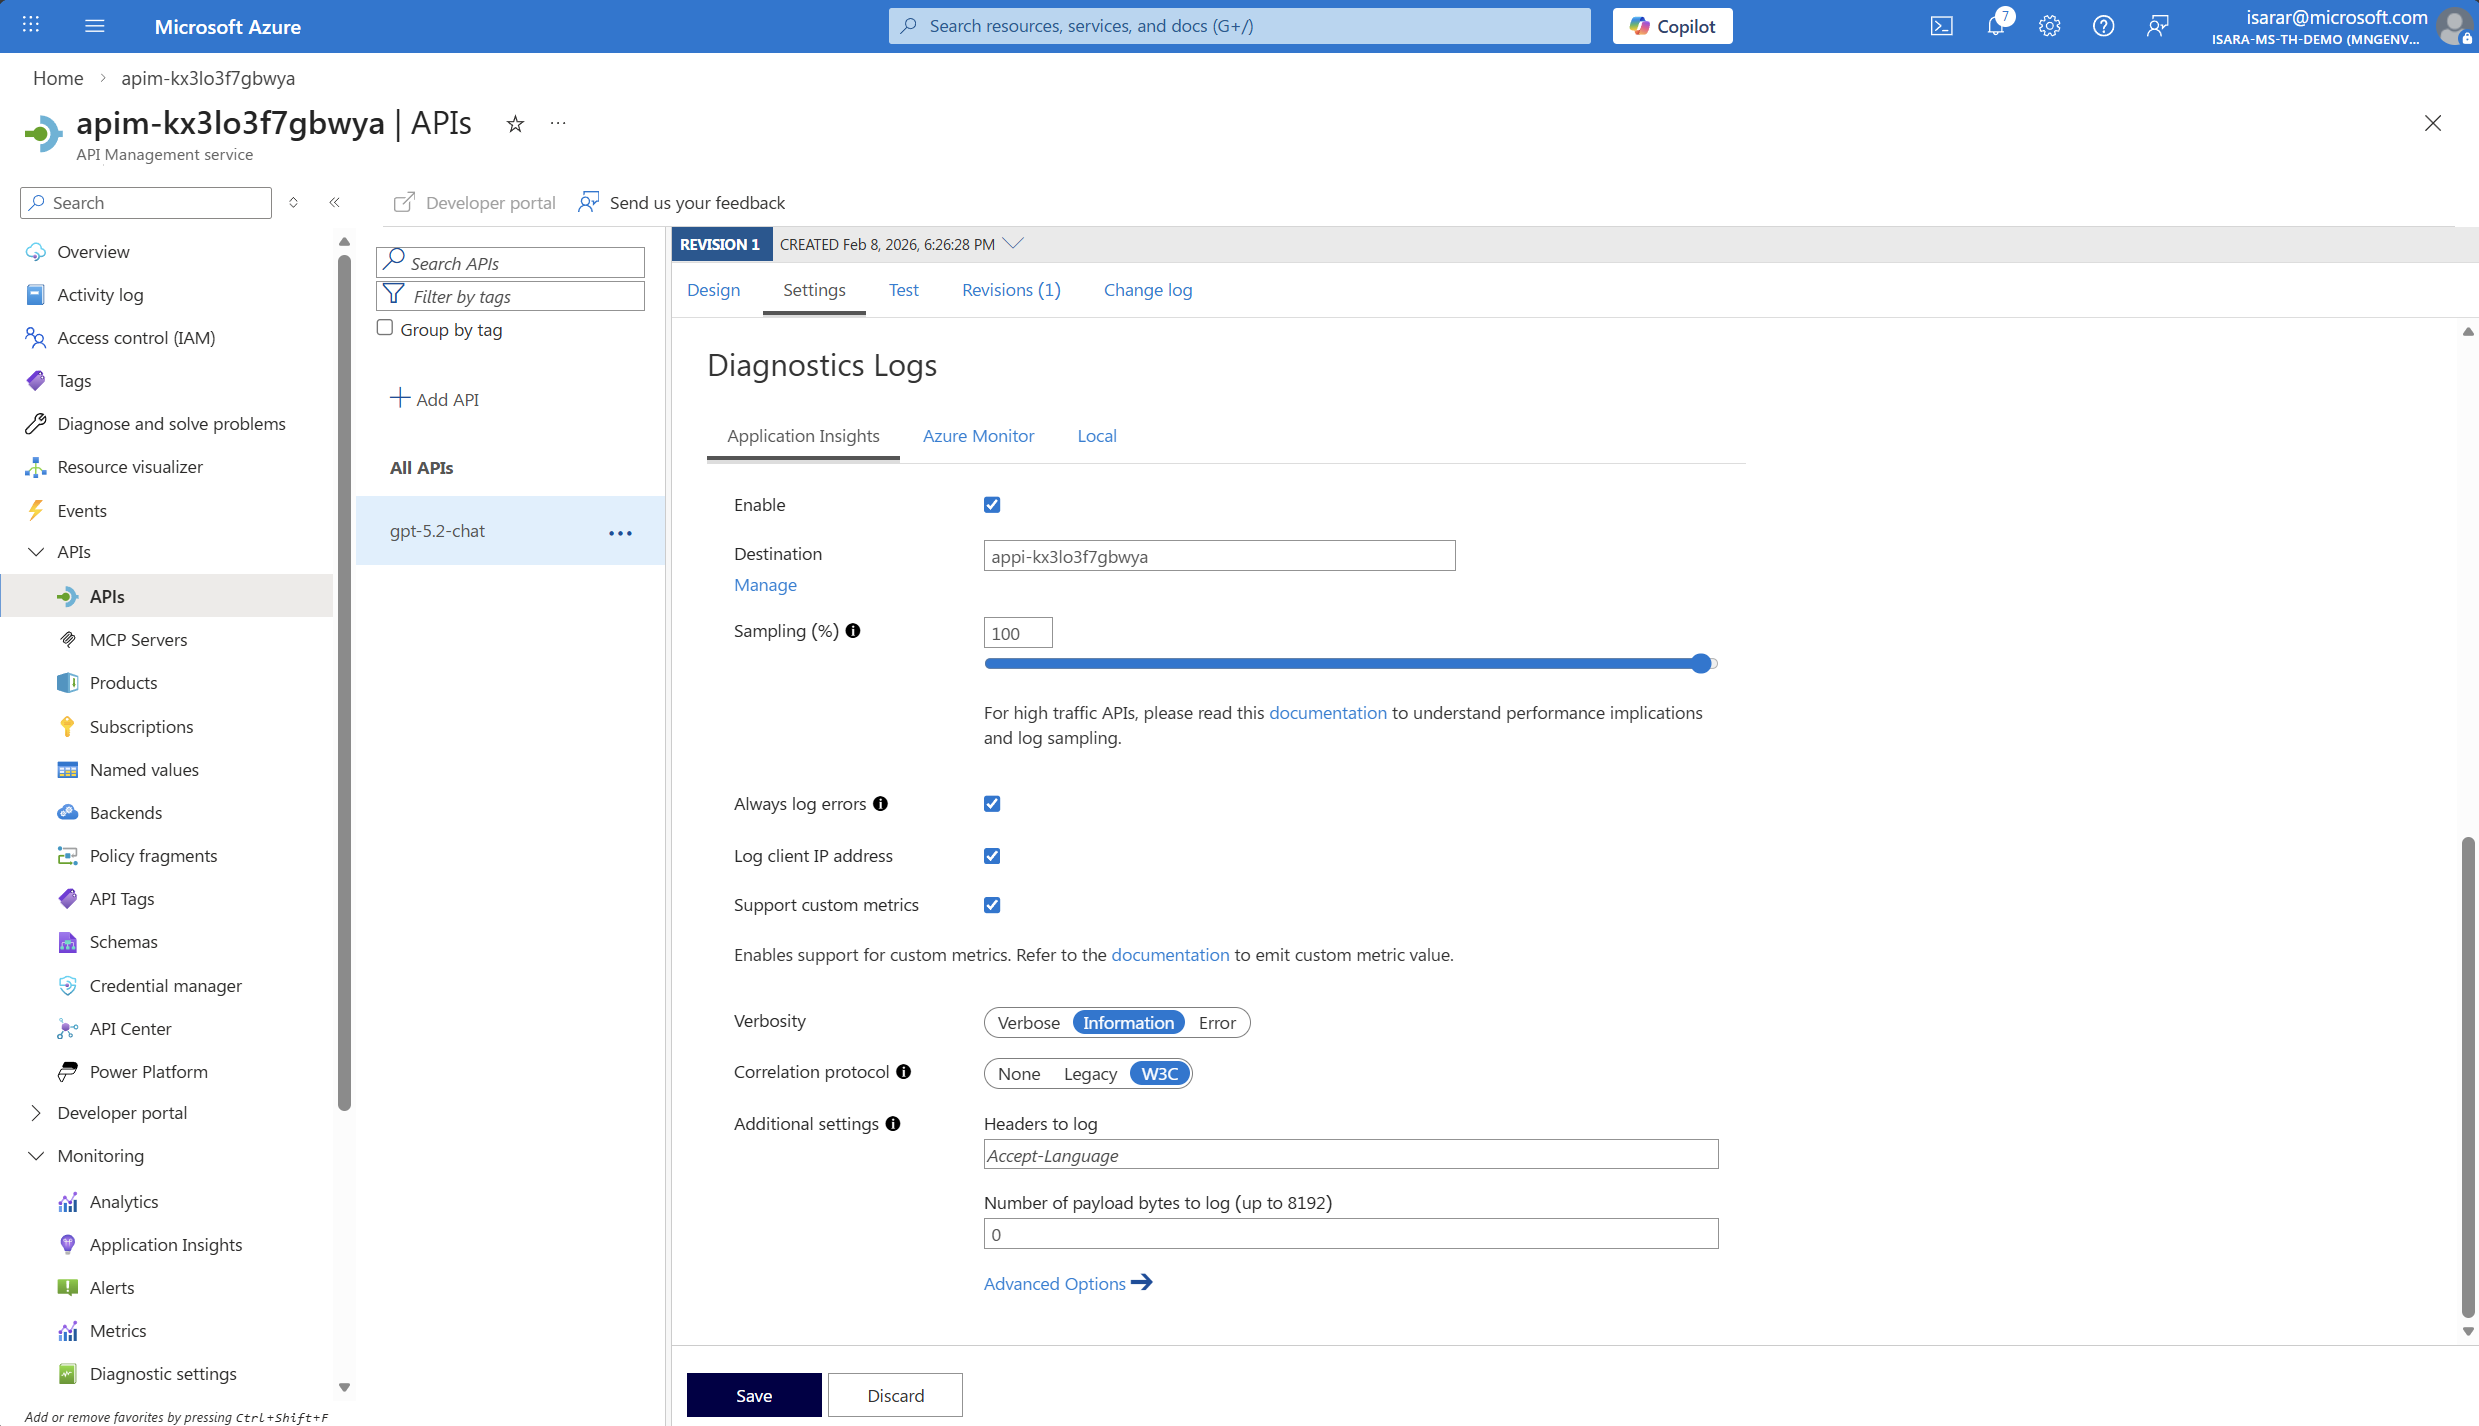
- On Correlation protocol, select W3C
- Click Save to save the change
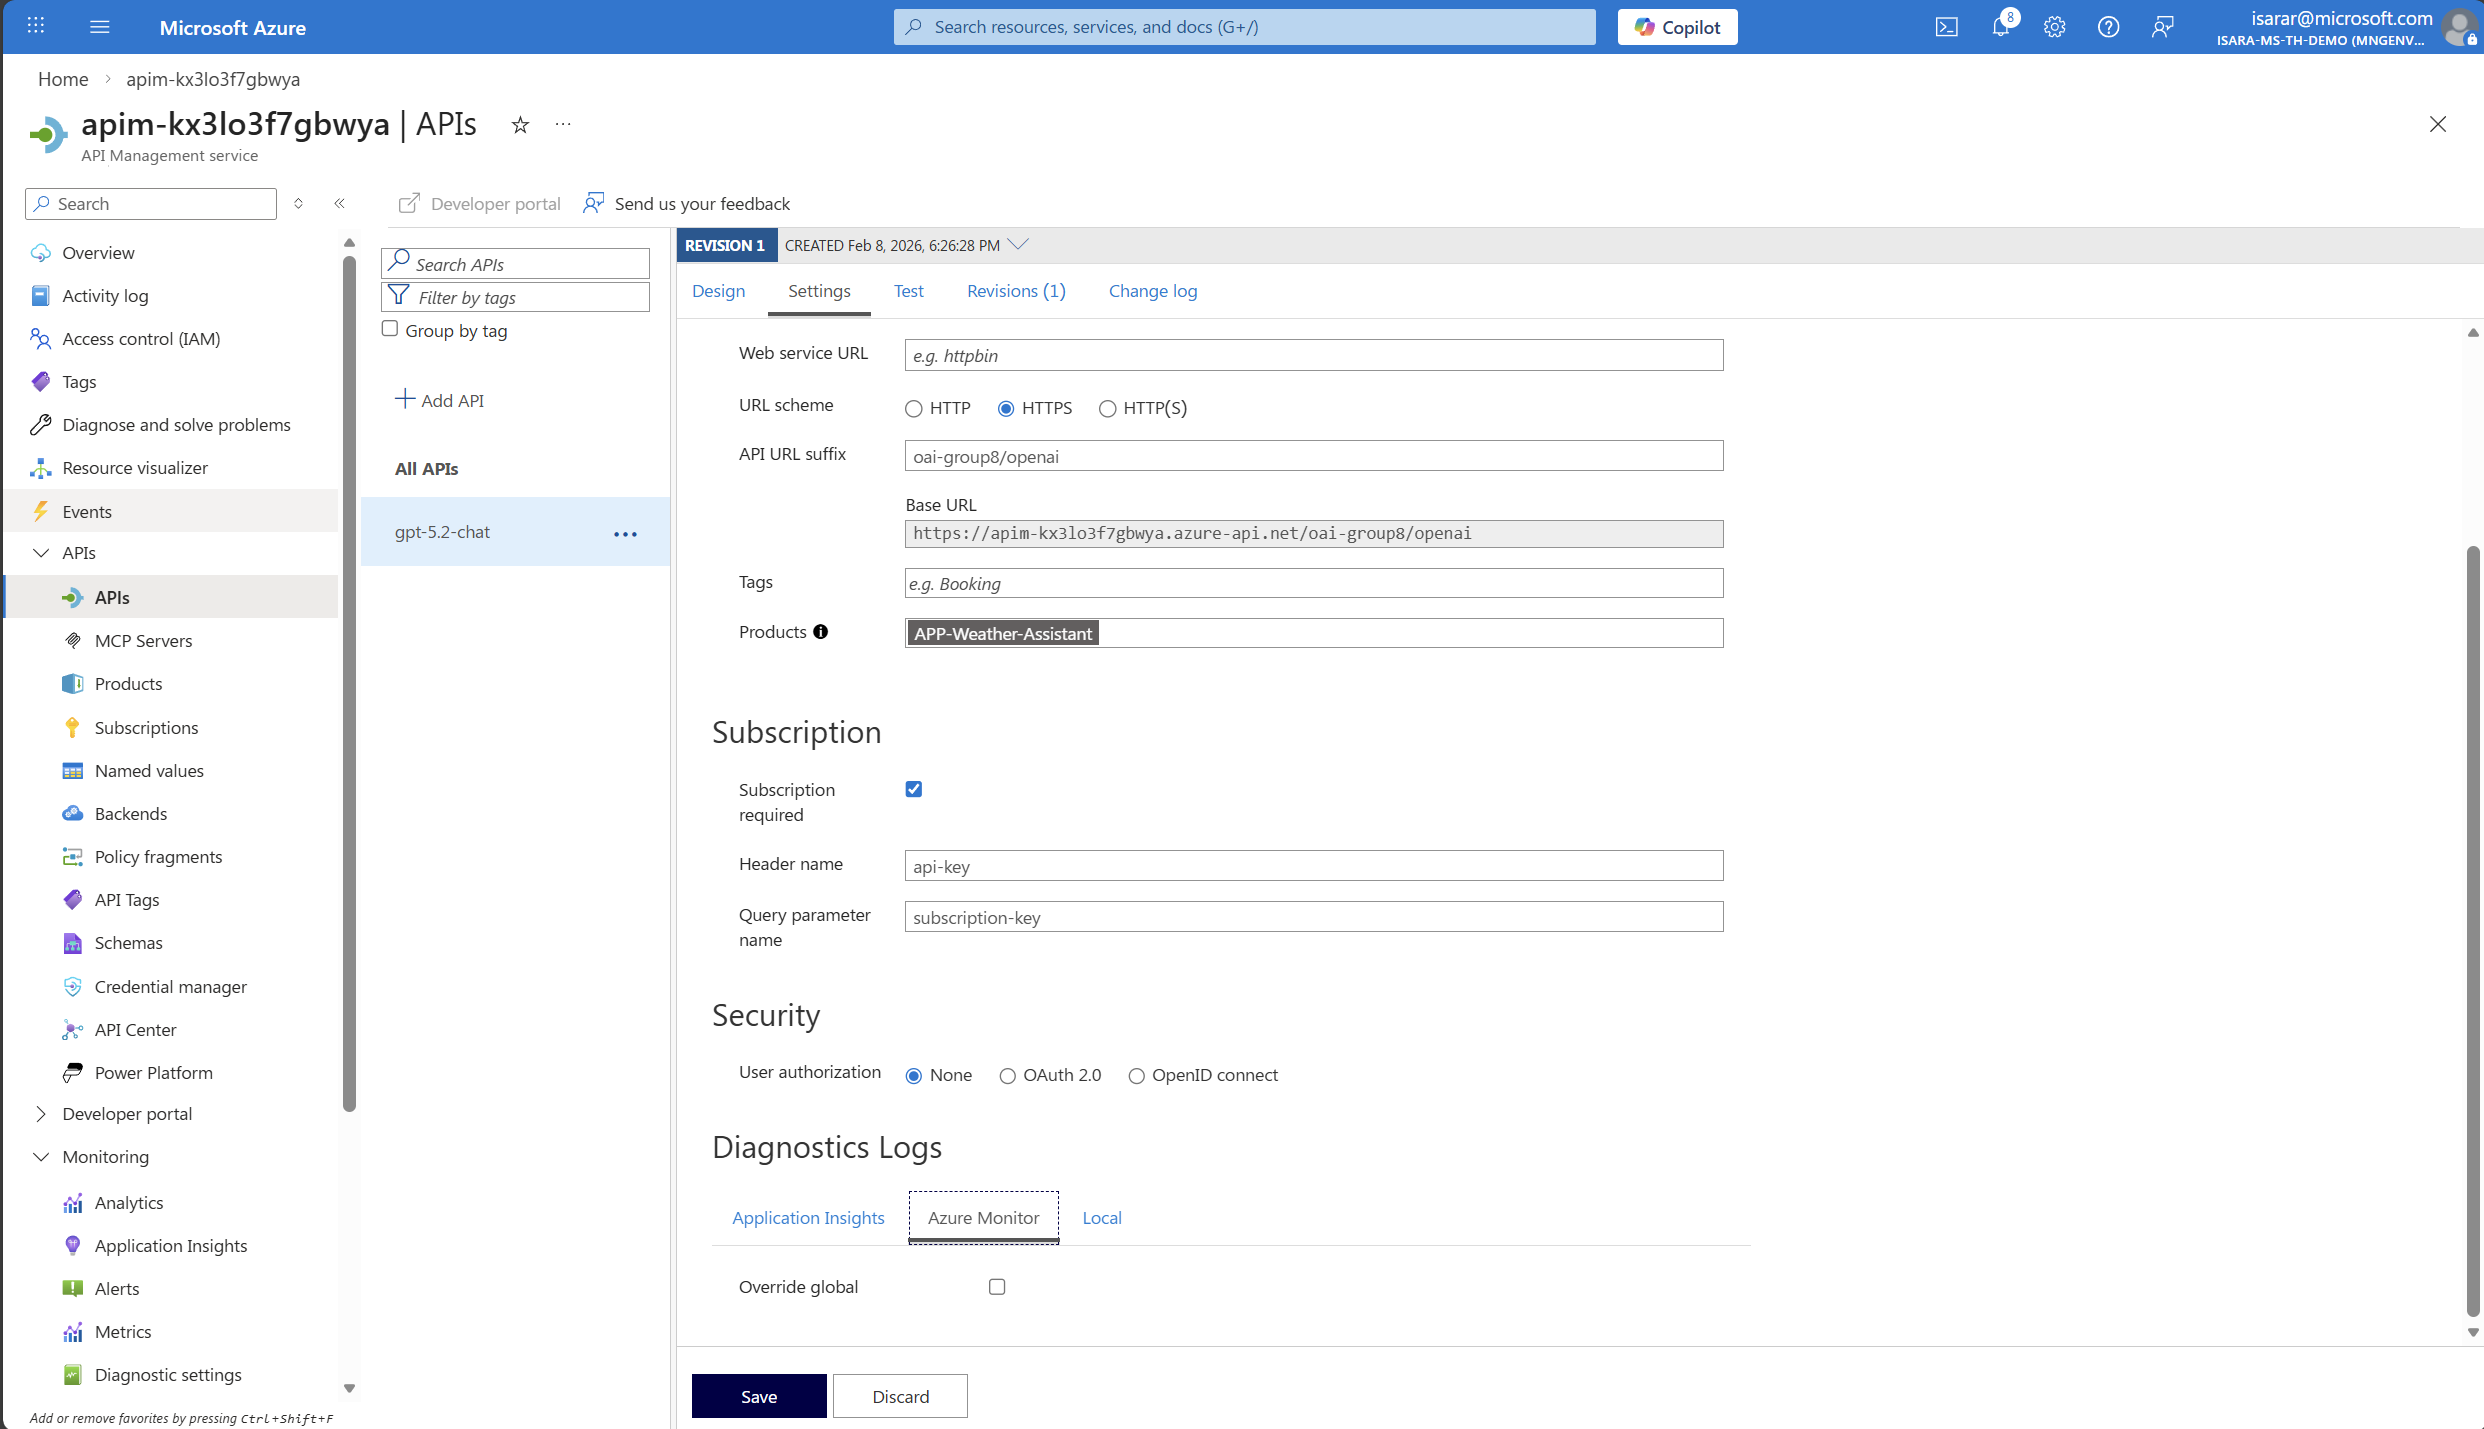
- Go back to API page. then Go to Azure Monitor tab
- Click on Override global, then enable Log LLM message
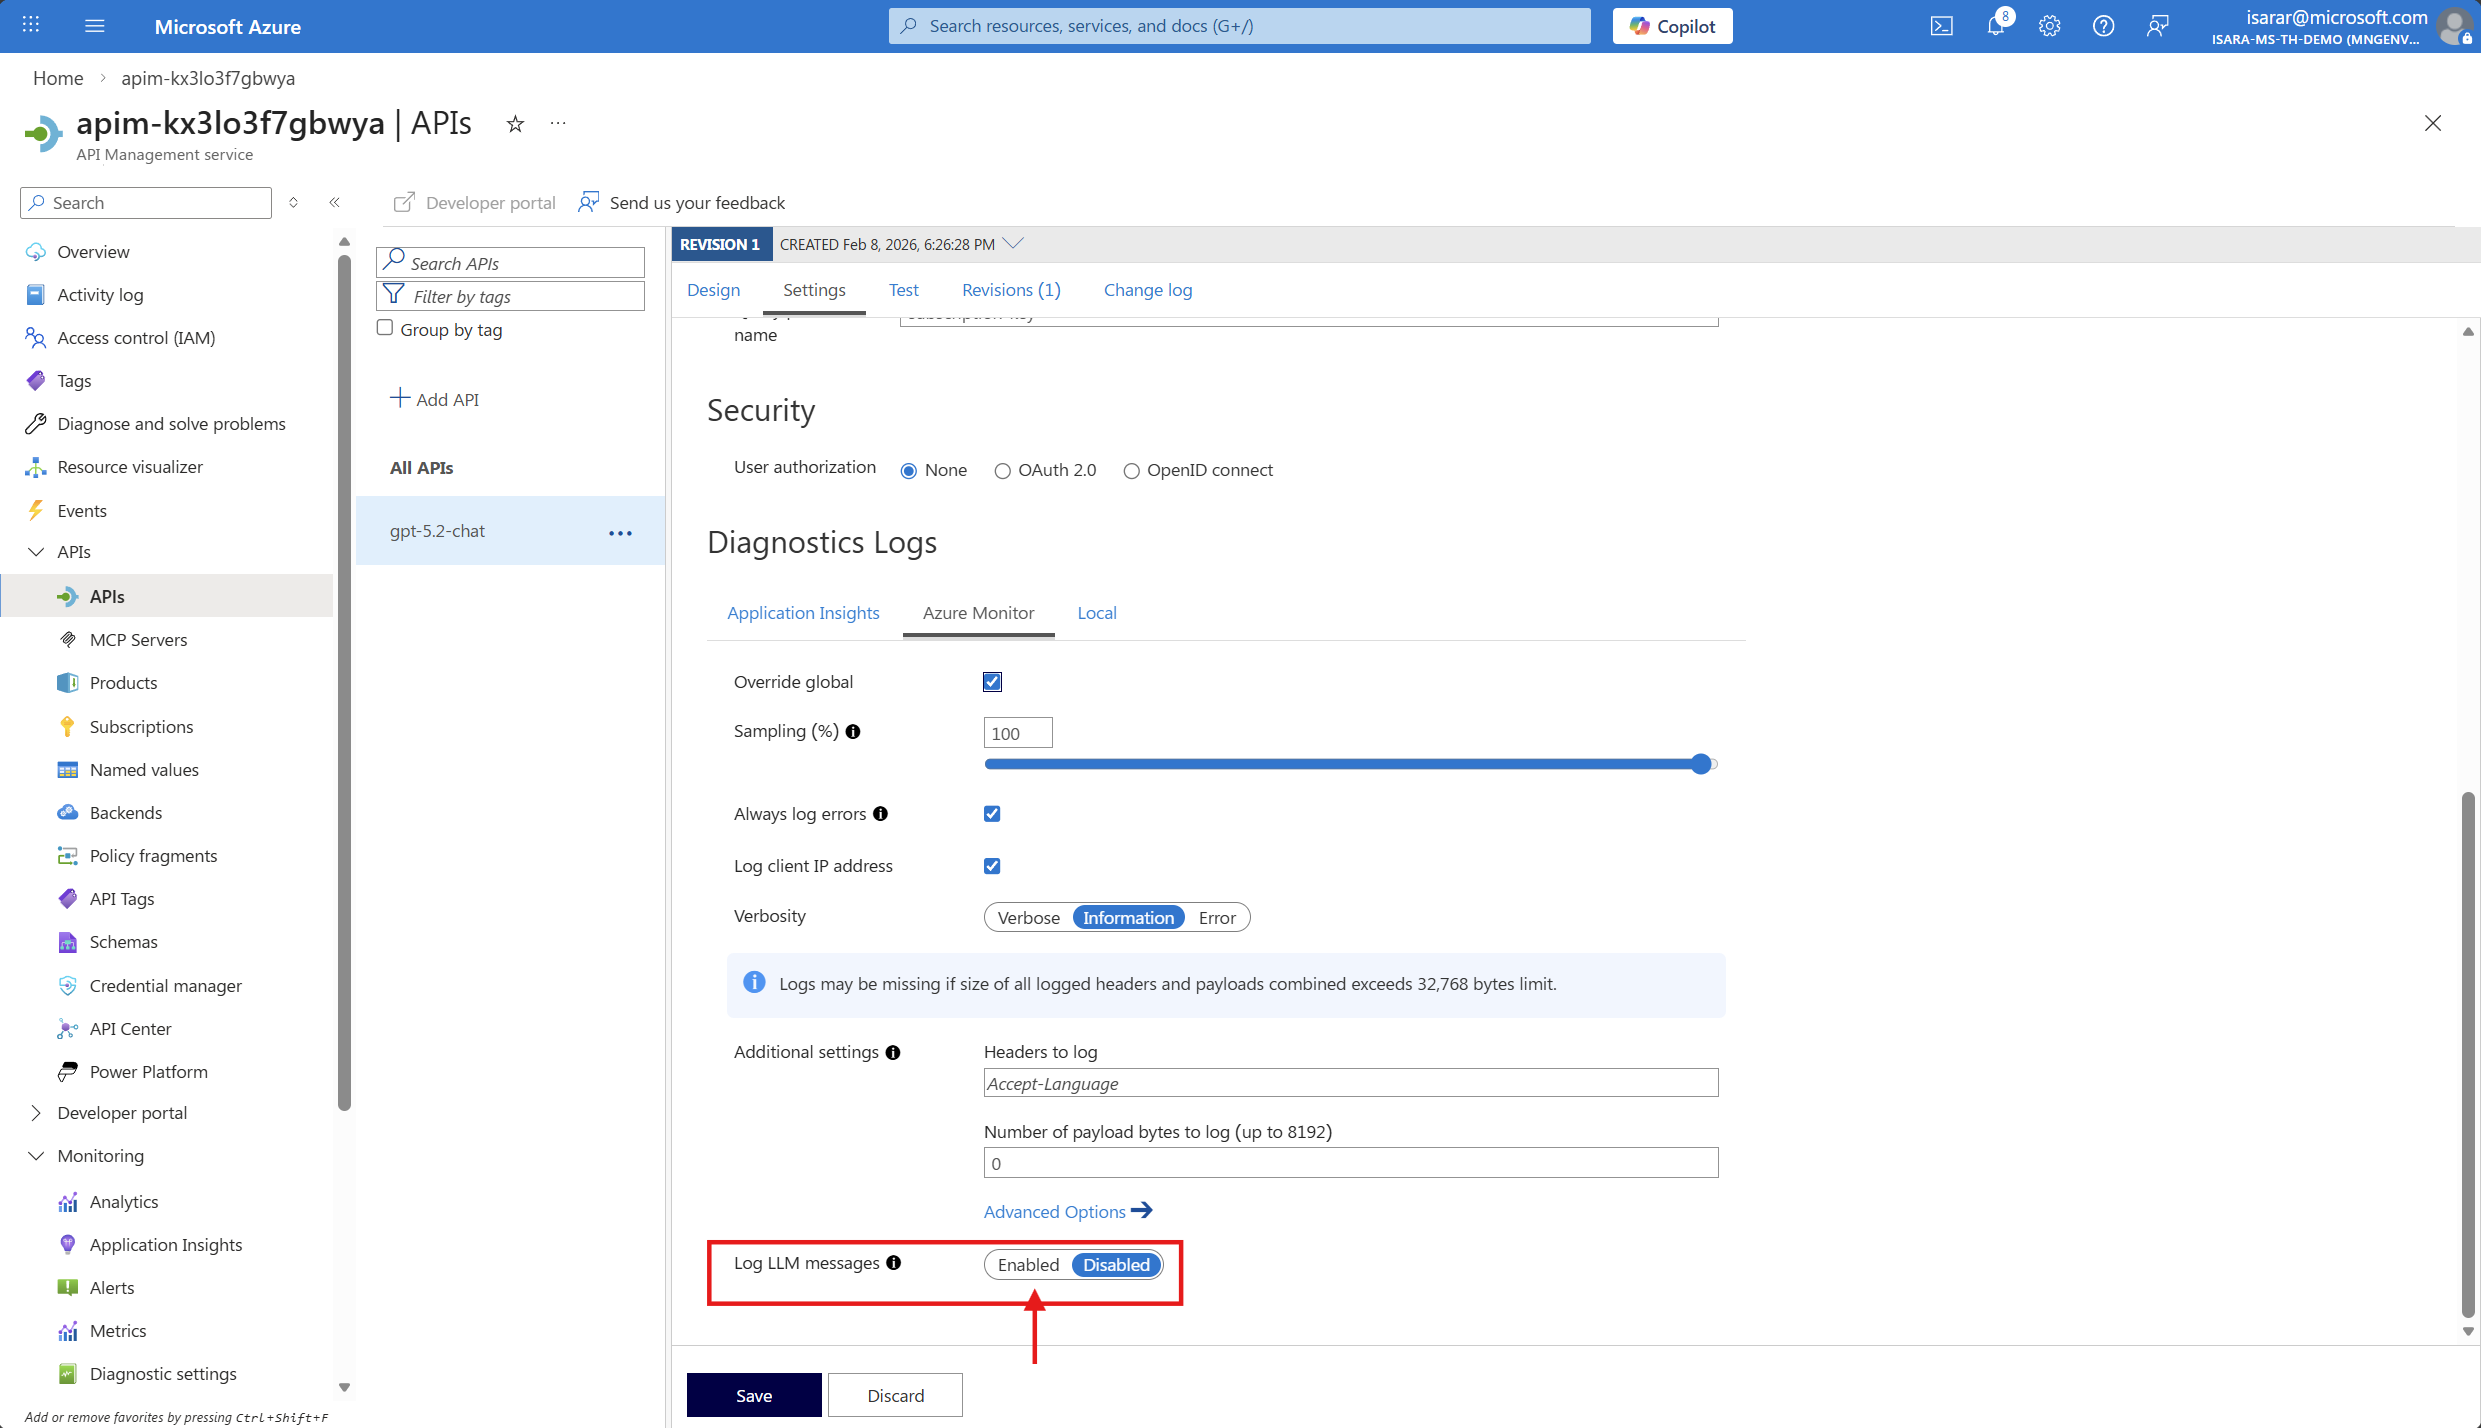
- Click Save to save the change
02: Inspect and configure the API policy
After enabling monitoring, you need to verify that the token tracking policy is properly configured and add any additional dimensions you want to track.
Expand this section to view the solution
-
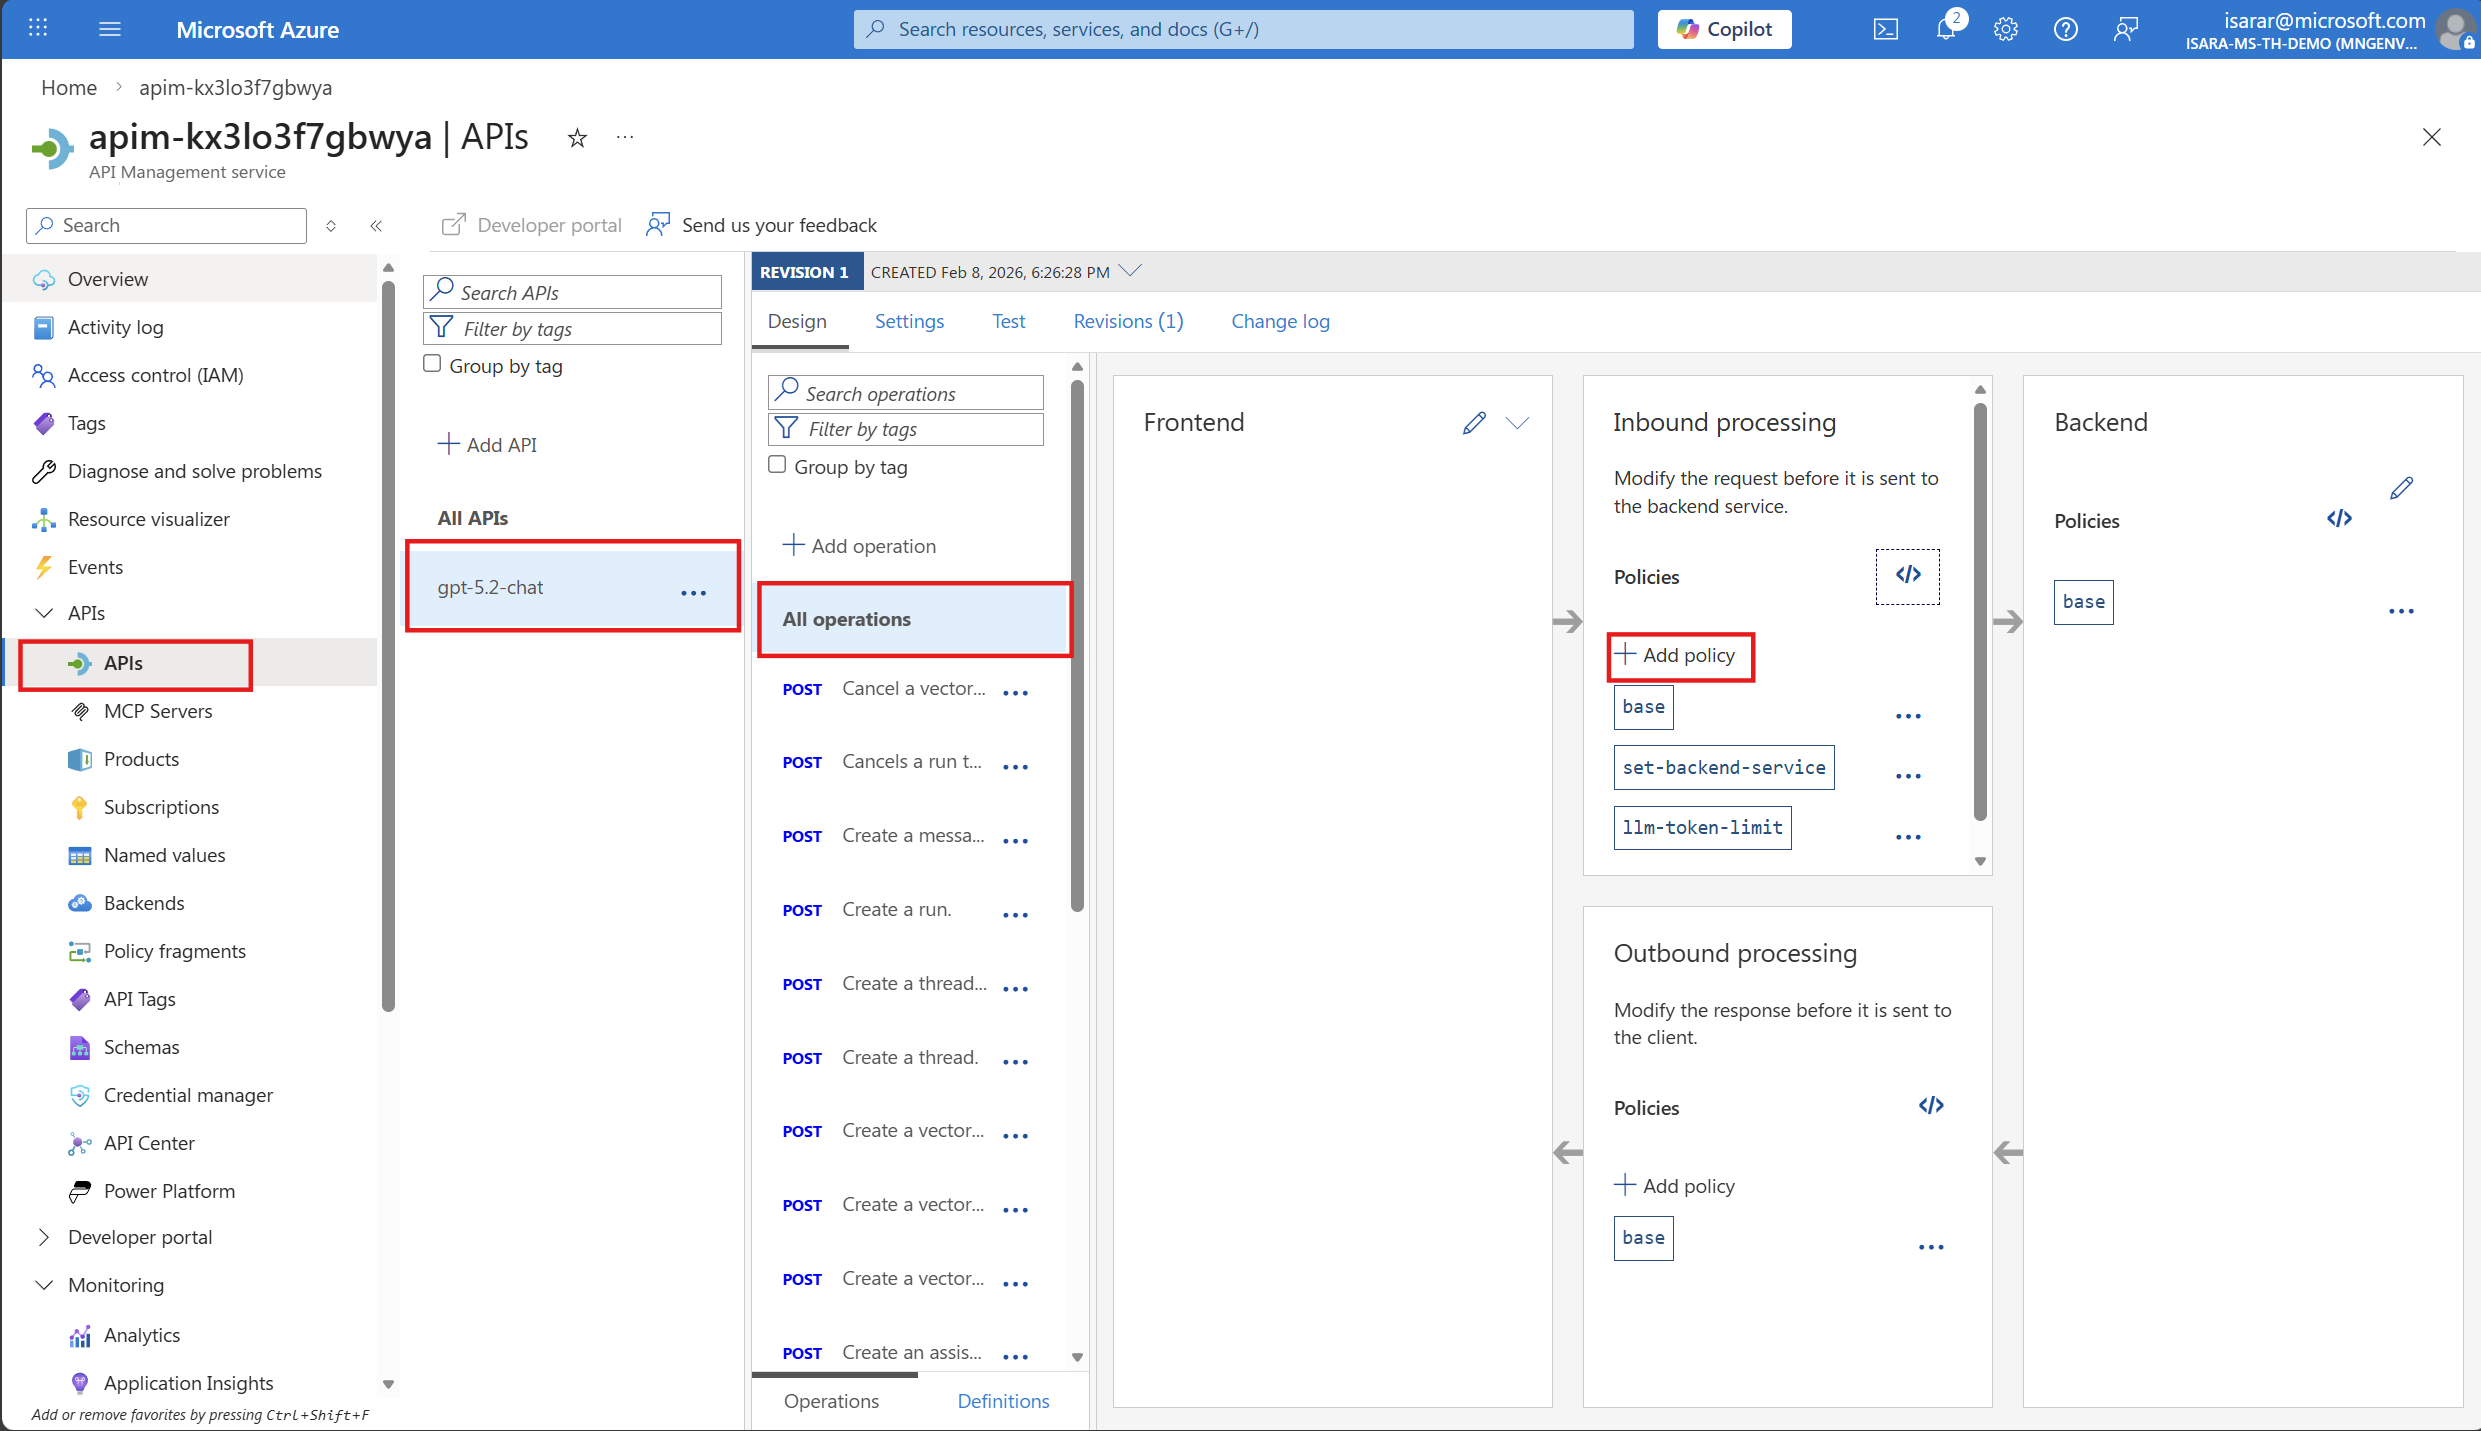
While still in your Azure OpenAI API in API Management, select the Design tab.
- Add additional dimensions for tracking, you can edit the policy by:
- Selecting the All operations scope
- Selecting </> (Code editor) in the Inbound processing section
- Adding or modifying the
azure-openai-emit-token-metricpolicy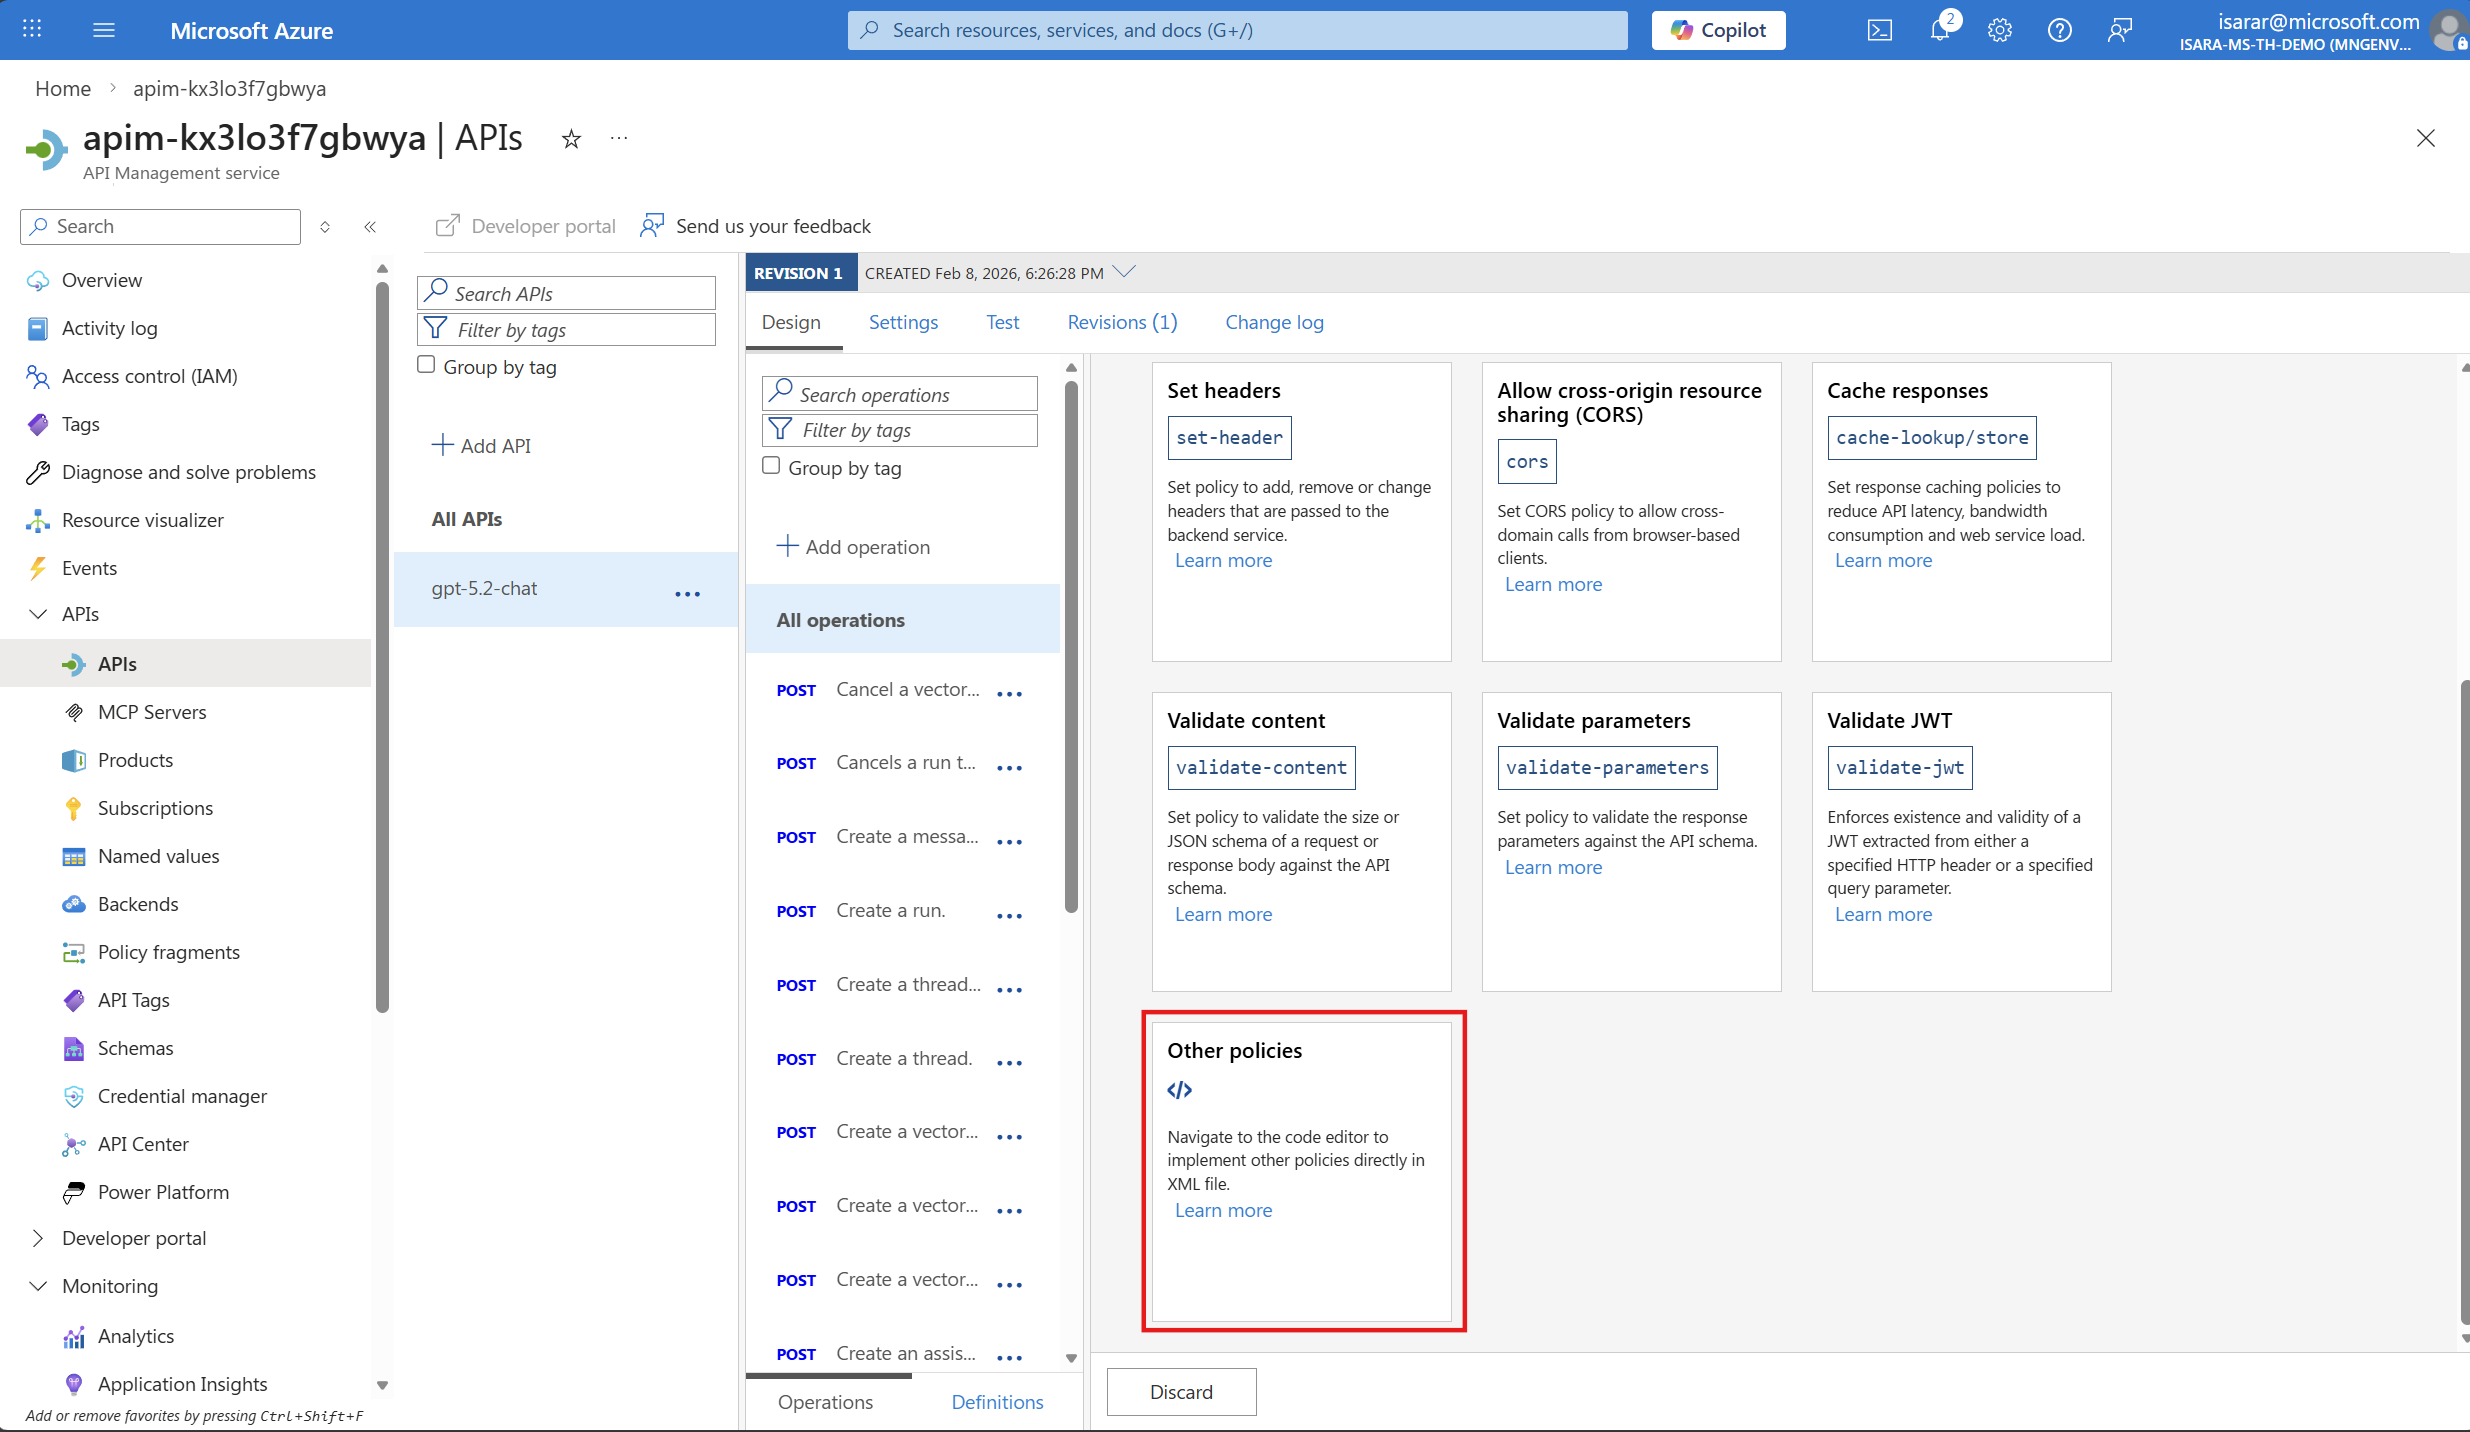
- Example policy snippet:
<azure-openai-emit-token-metric>
  <dimension name="API ID" />
  <dimension name="Product ID" />
  <dimension name="Subscription ID" />
  <dimension name="User ID" />
</azure-openai-emit-token-metric>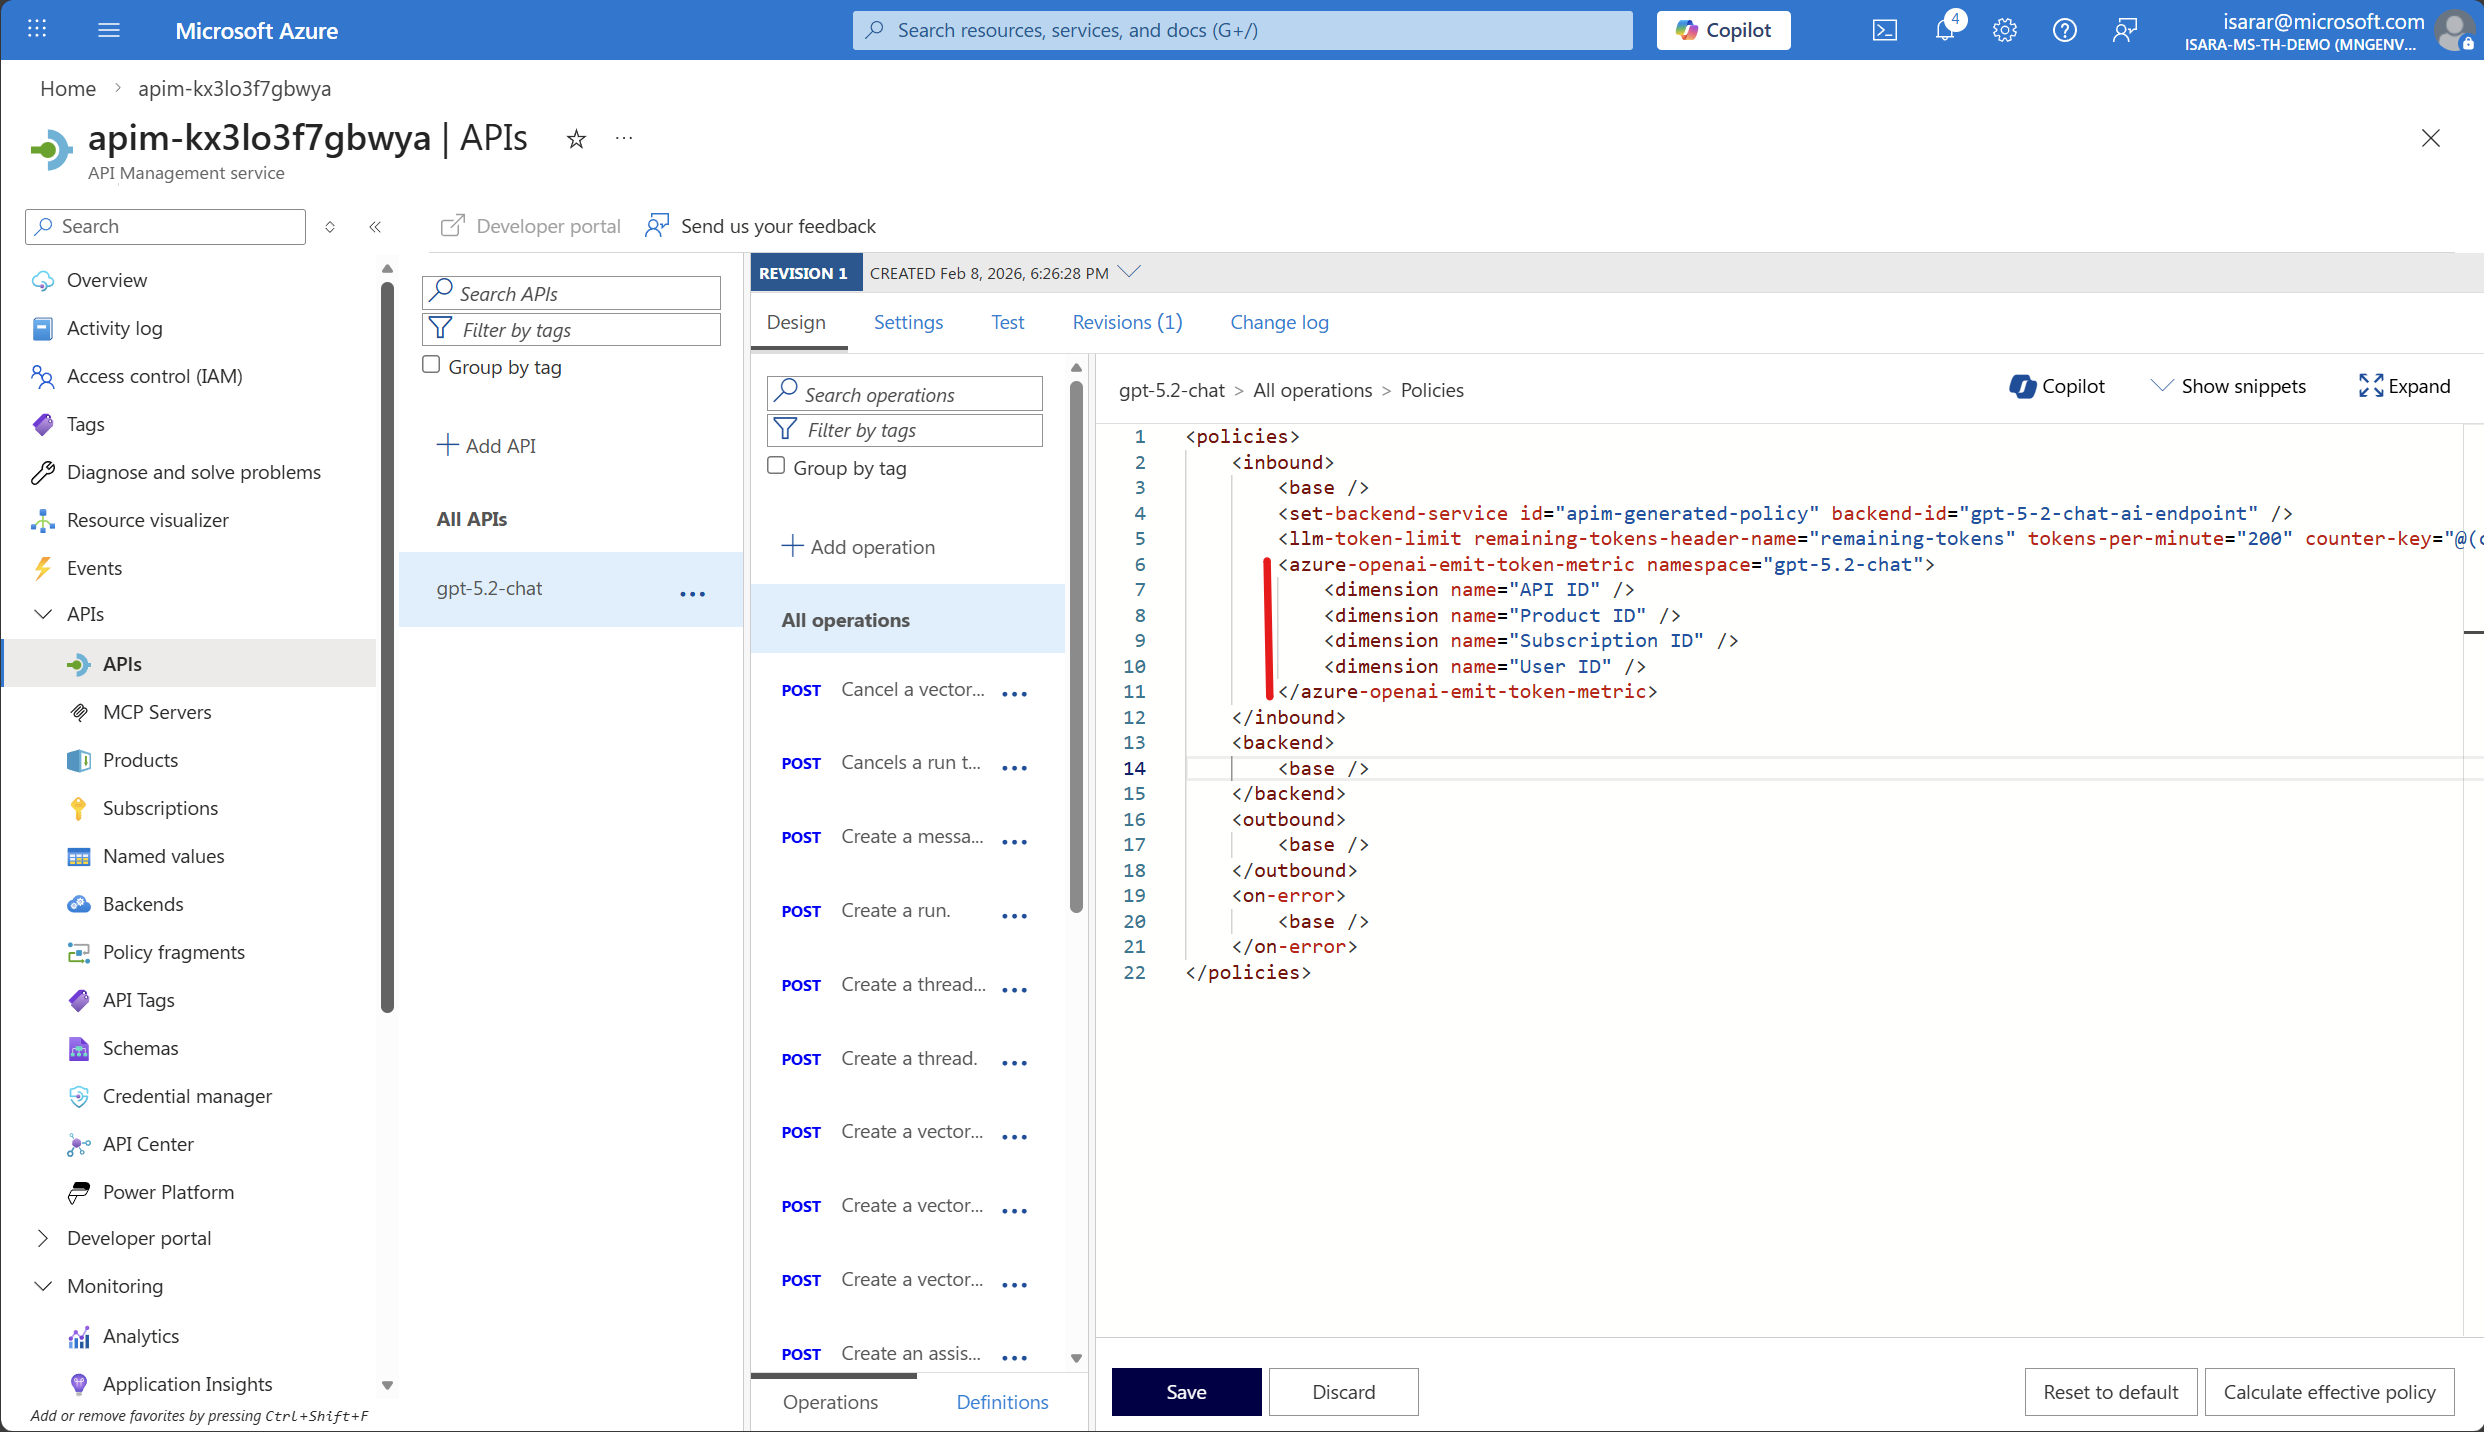
- Select Save after making any policy changes.
03: Test the API and generate token metrics
To verify that monitoring is working correctly, you need to send test requests to your Azure OpenAI API and generate token consumption data.
Expand this section to view the solution
-
In your Azure OpenAI API, select the Test tab.
-
Select the Creates a completion for the chat message operation (or similar chat completion endpoint).
-
Fill in the required parameters:
Setting Value Description deployment-id gpt-5.2-chatYour Azure OpenAI deployment name (verify in Azure AI Foundry) api-version 2025-03-01-previewA supported API version -
In the Request body section, enter the following JSON:
{ "messages": [ { "role": "system", "content": "you are a friendly assistant" }, { "role": "user", "content": "how is the weather in Bangkok?" } ], "max_completion_tokens":50 } -
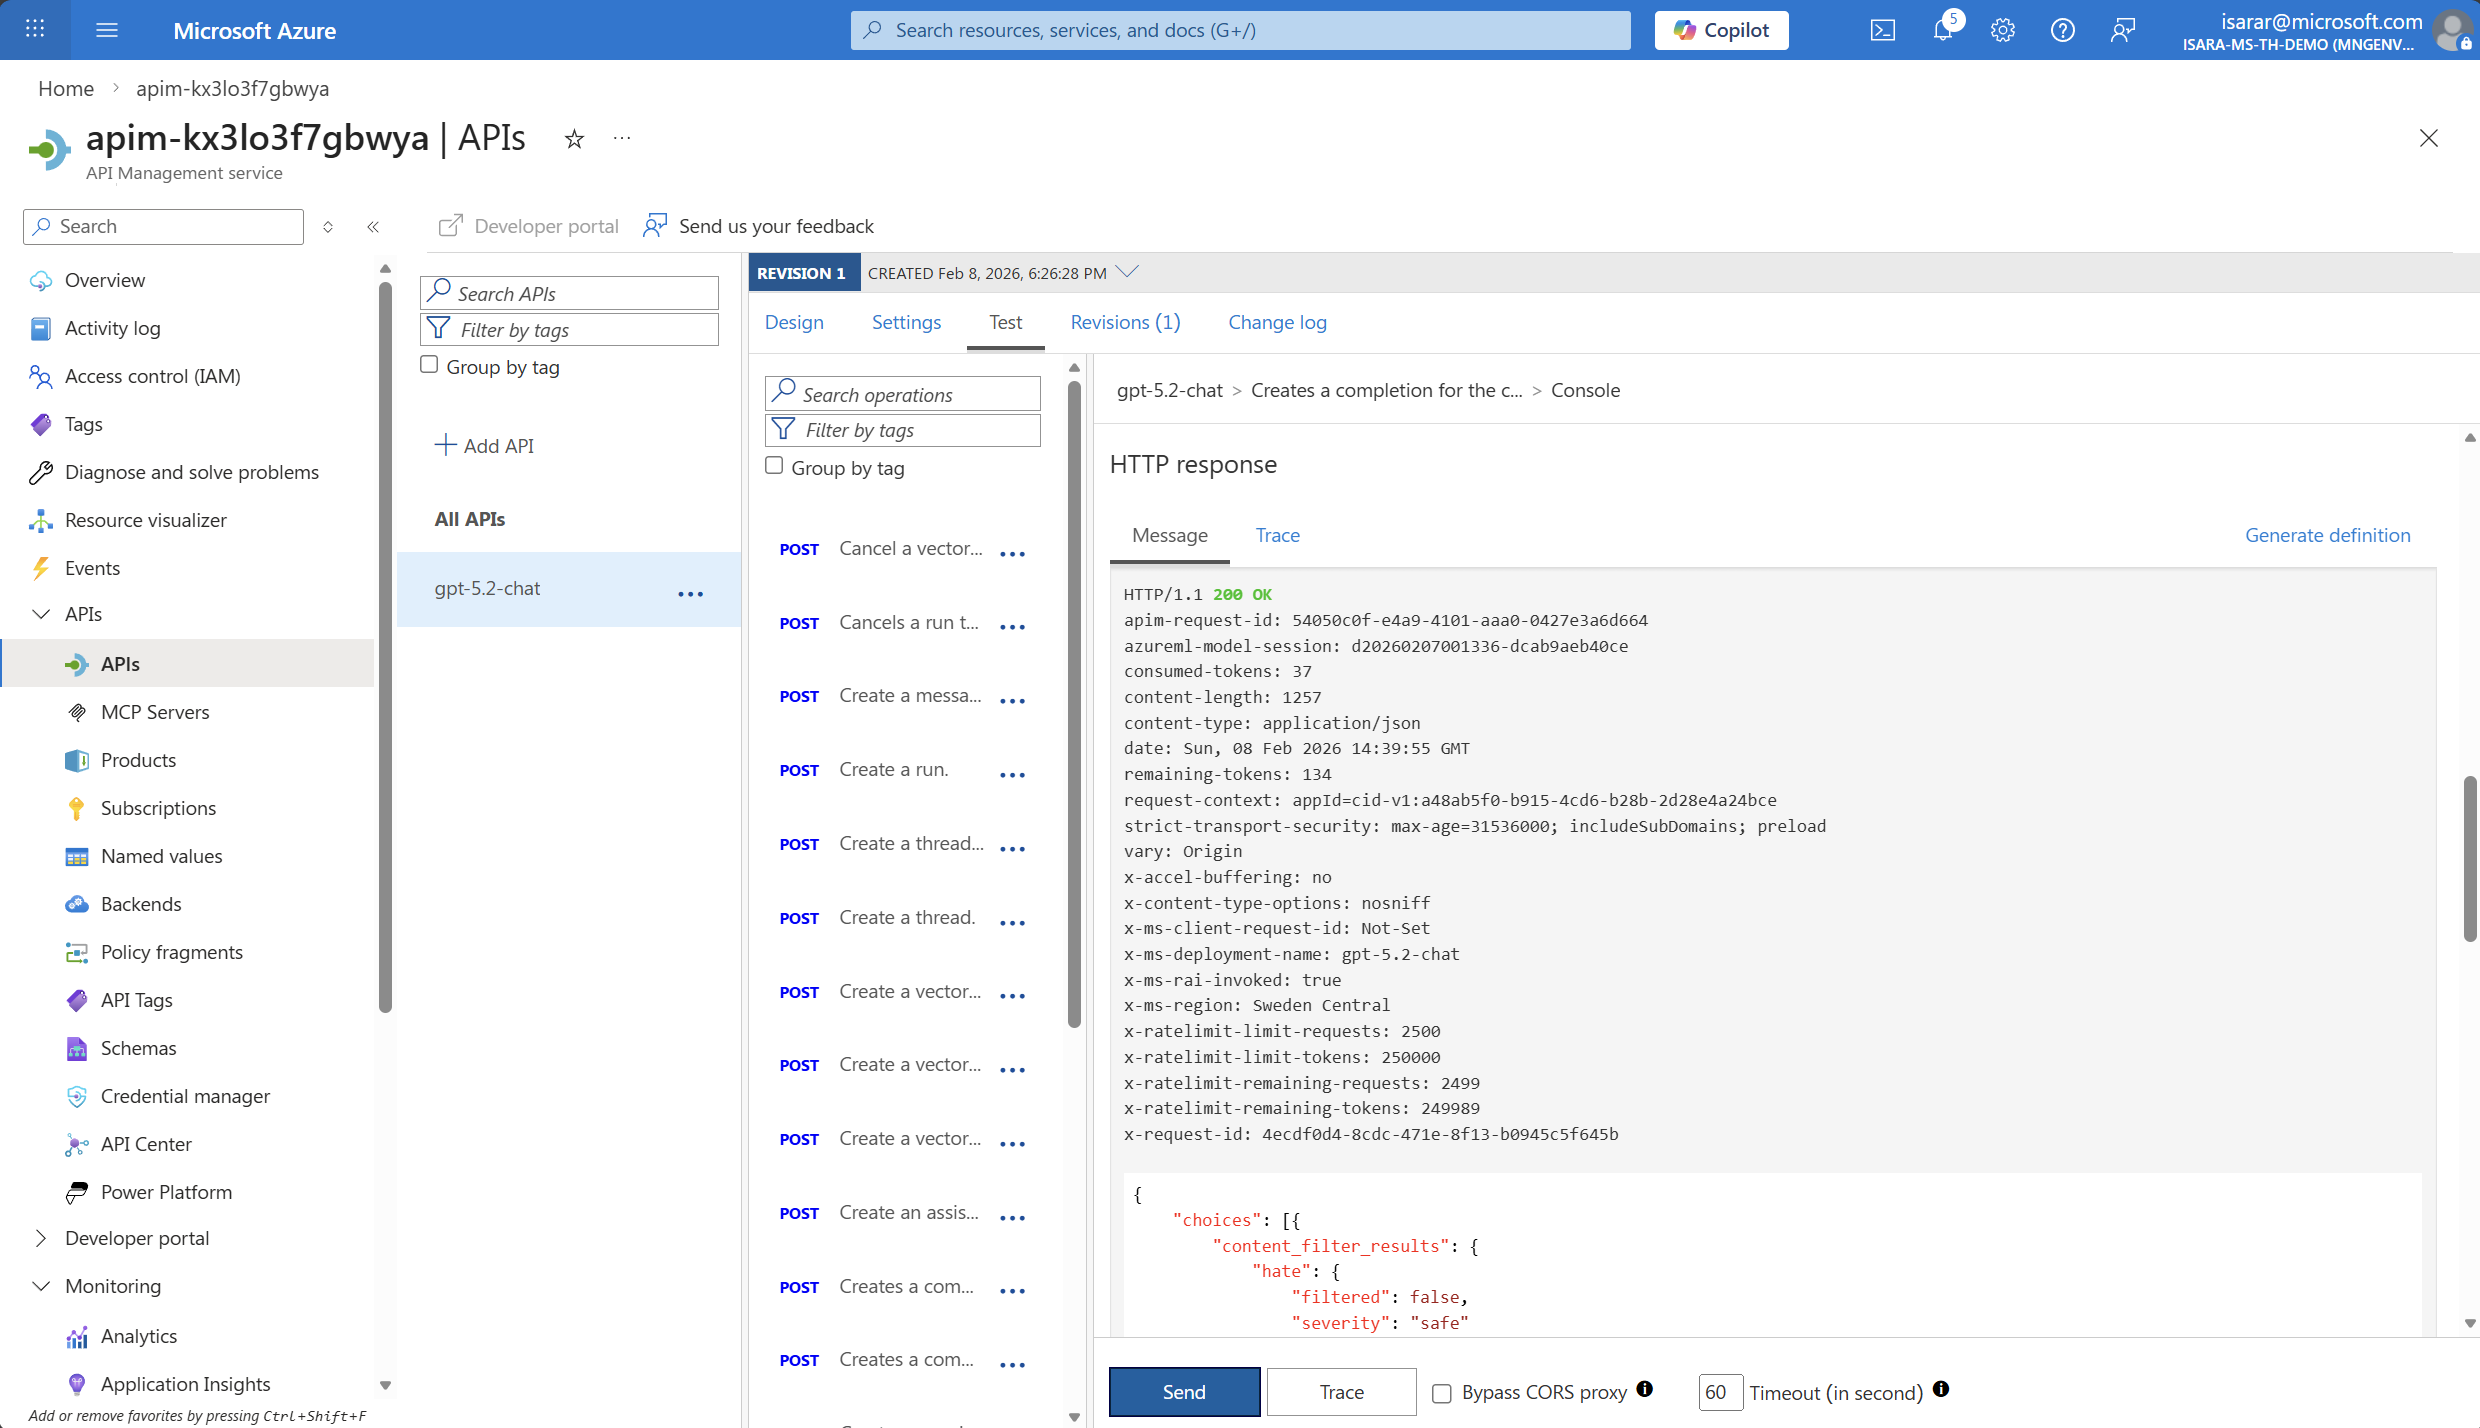
Select Send to execute the request.
-
You should receive a successful response (HTTP 200) with the AI-generated completion.
-
Run multiple test requests with different prompts to generate enough data for meaningful metrics. Try variations like:
- Short prompts (e.g., “Hello”)
- Longer prompts (e.g., “Explain the concept of machine learning in detail”)
- Different conversation contexts
Make sure to run at least 5-10 test requests to generate sufficient data for viewing in Application Insights. Metrics may take a few minutes to appear in the dashboard.
04: View token consumption metrics in Application Insights
After generating test data, you can view the token consumption metrics in Application Insights to analyze your AI usage patterns.
Expand this section to view the solution
-
In your API Management instance, navigate to Monitoring > Application Insights in the left menu.
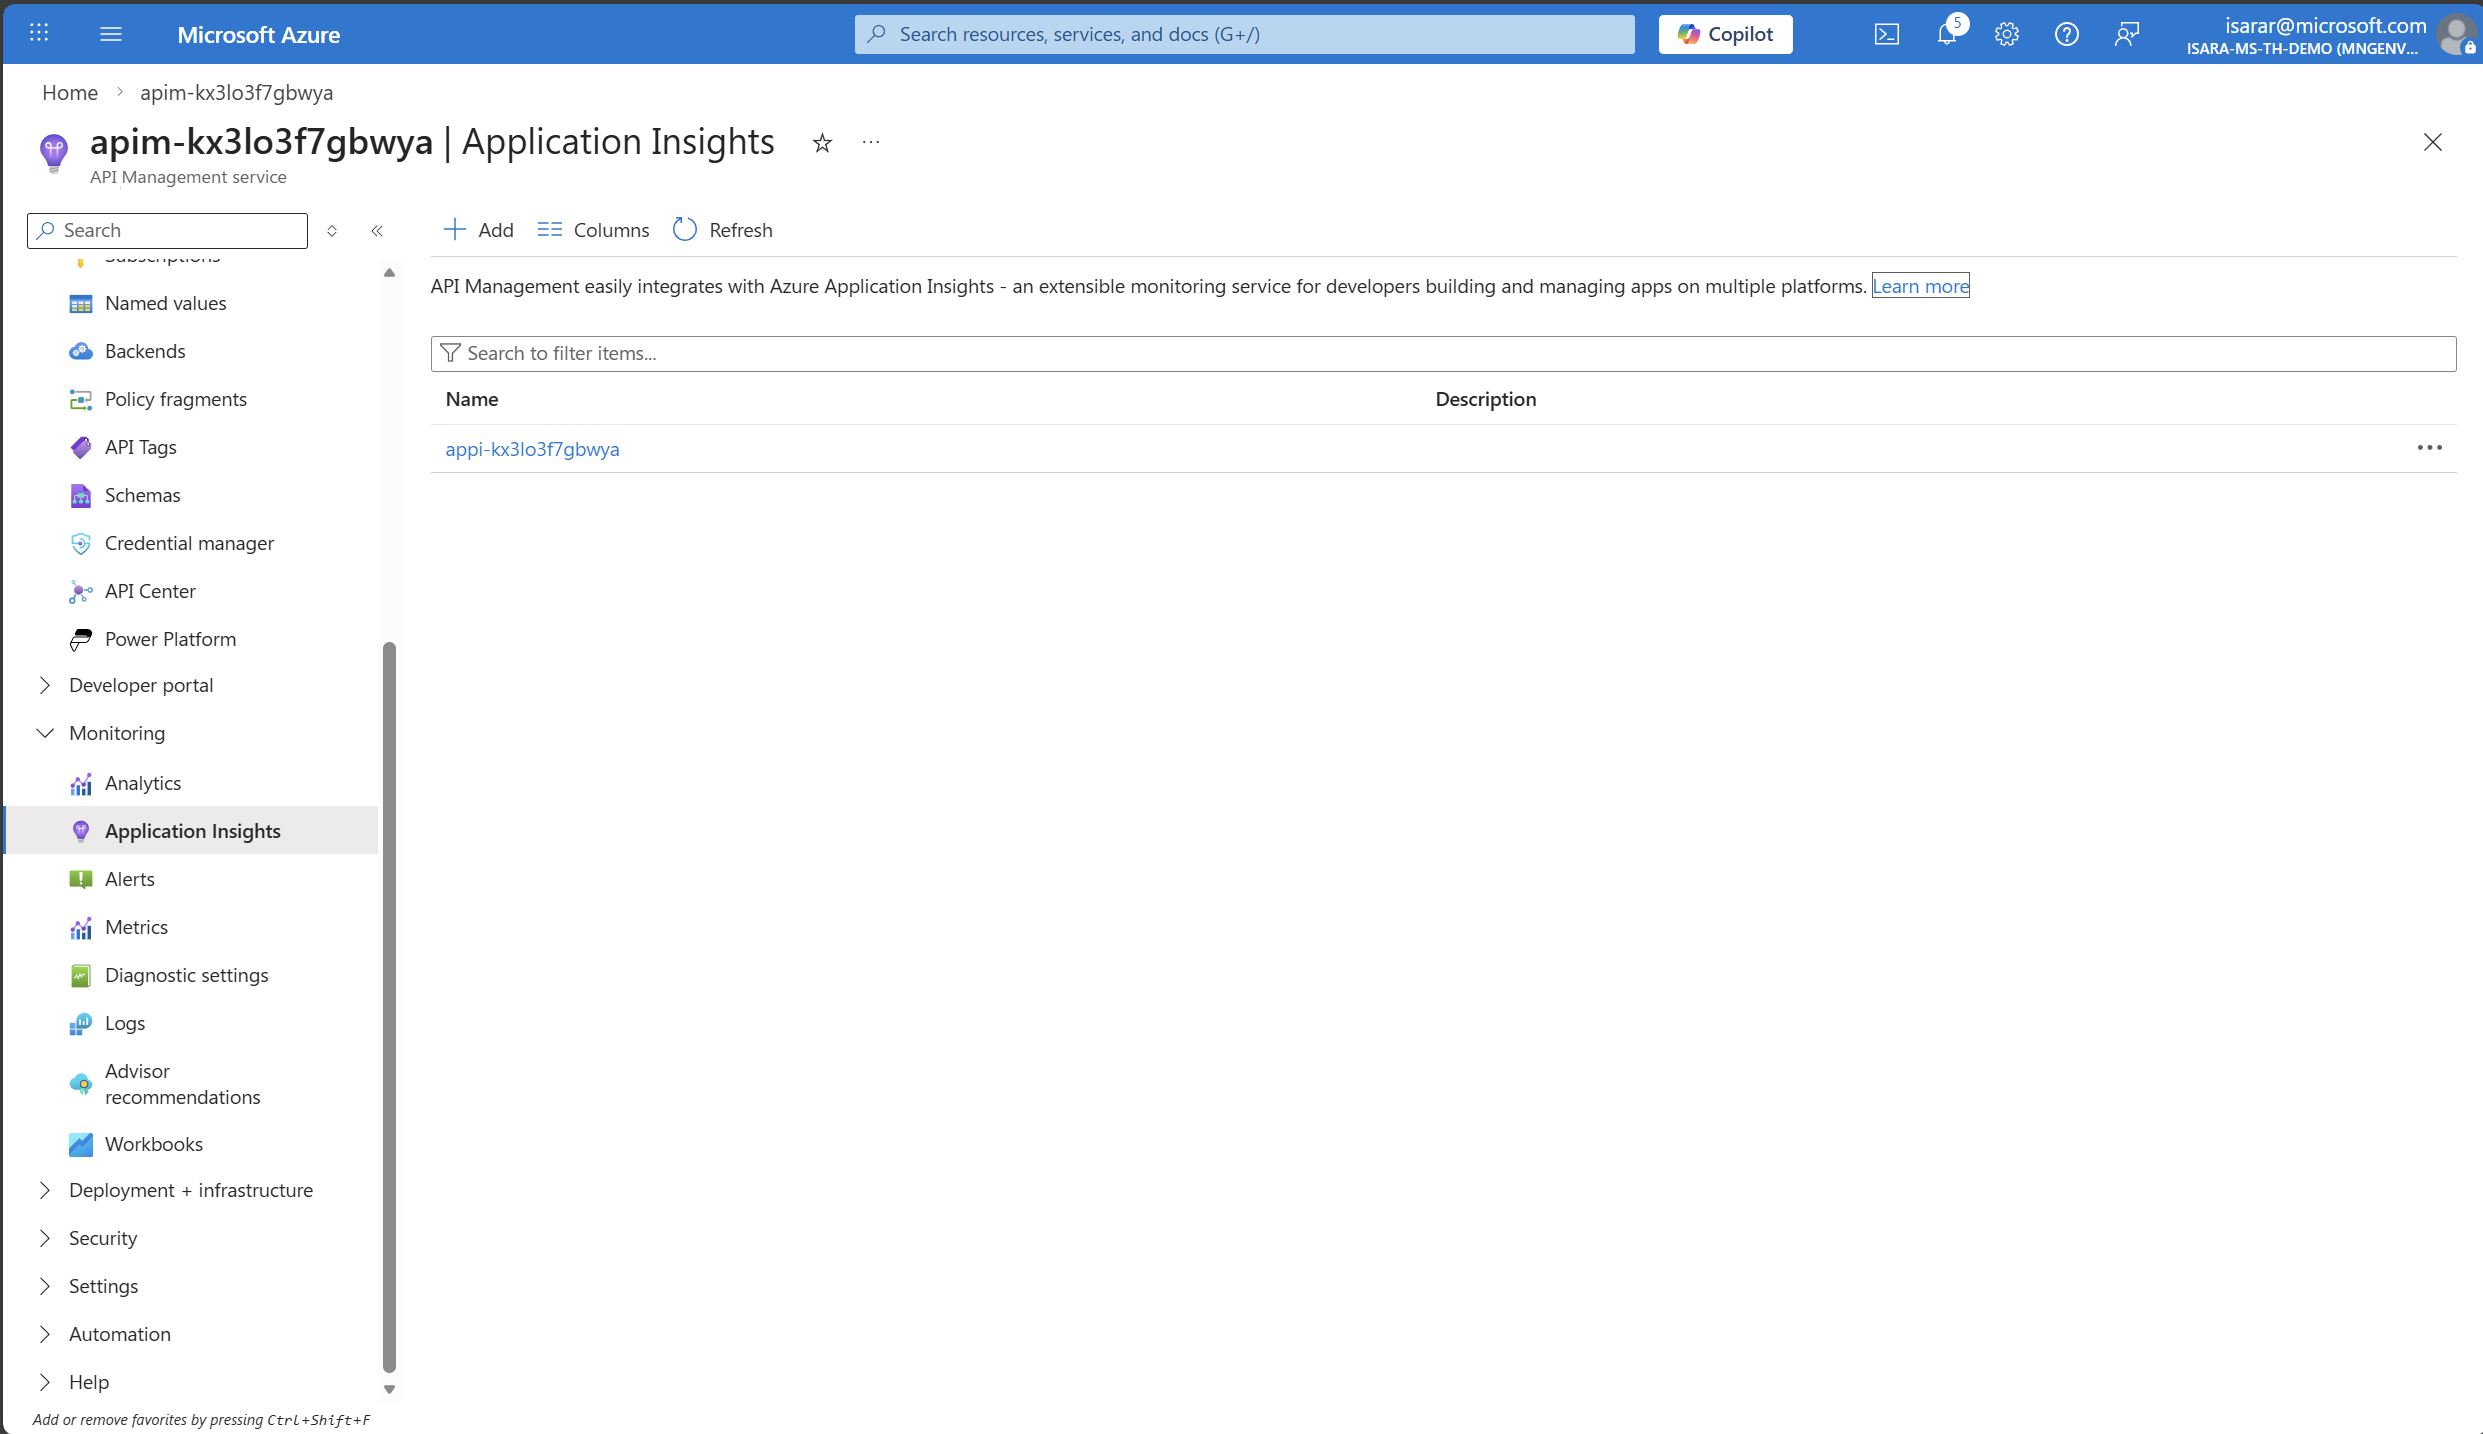
-
Select your Application Insights instance to open it.
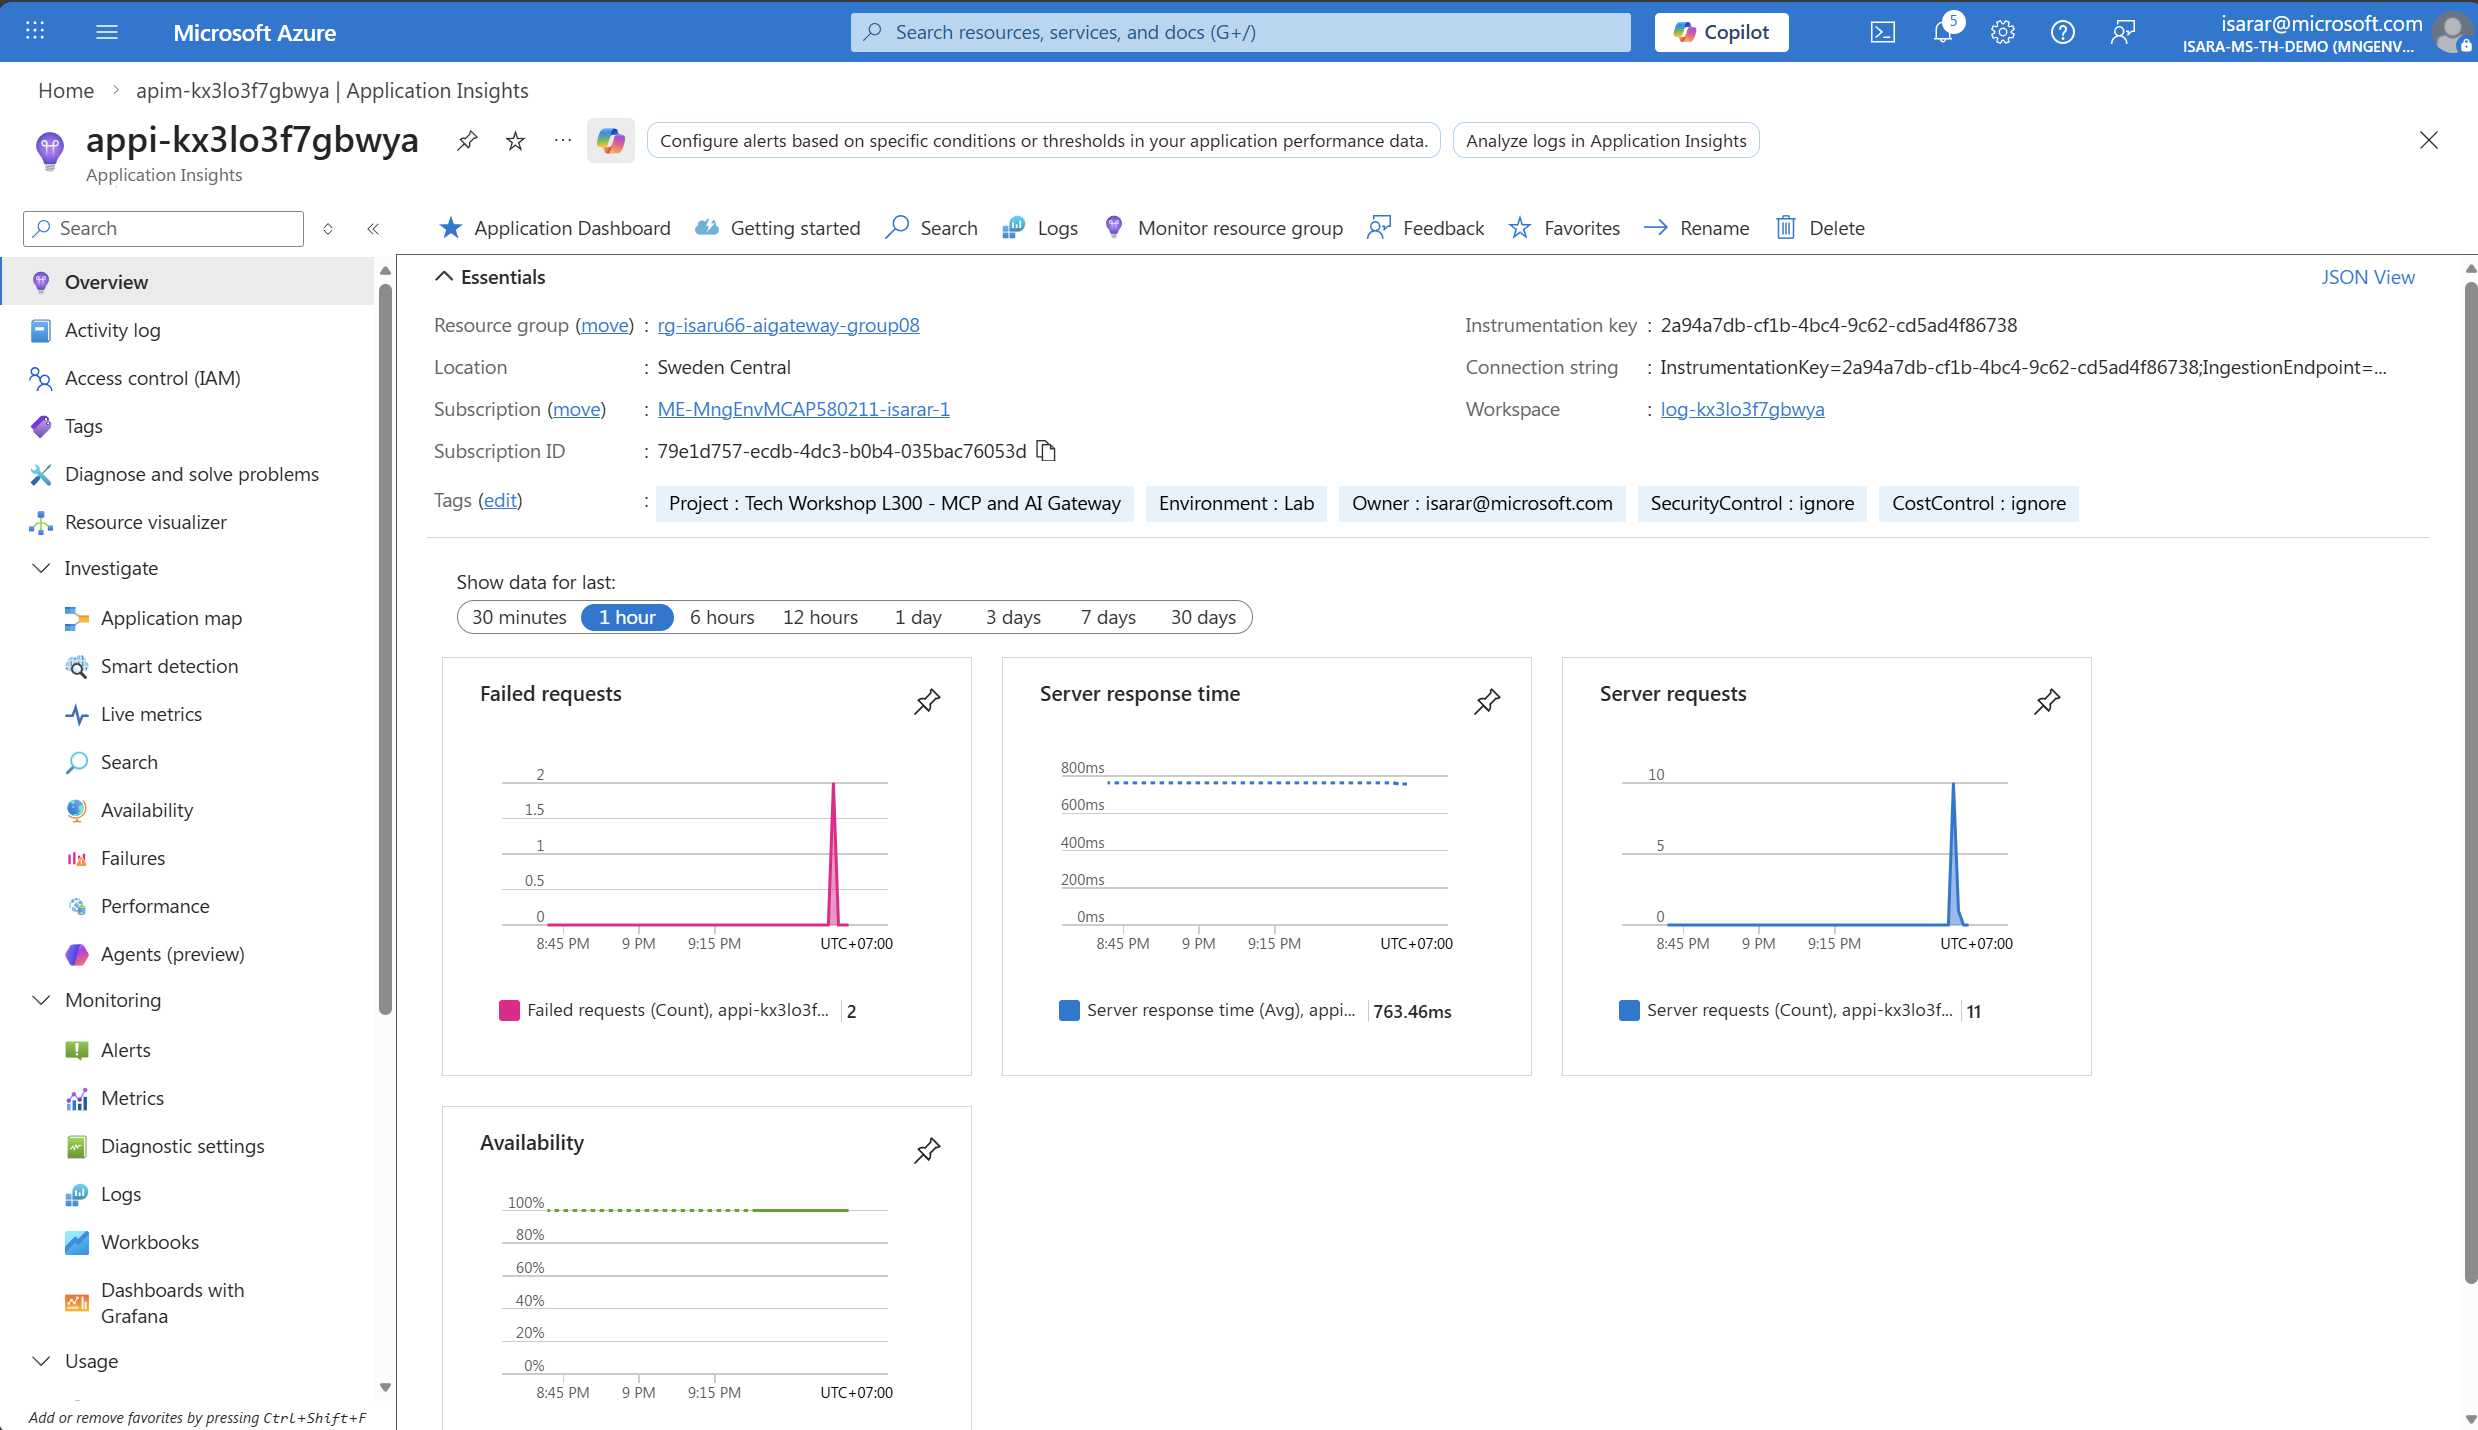
-
In Application Insights, select Monitoring > Metrics from the left menu.
Metrics may take approximately 5 minutes to appear in Application Insights after making API requests. If you don’t see data immediately, wait a few minutes and refresh the metrics dashboard.
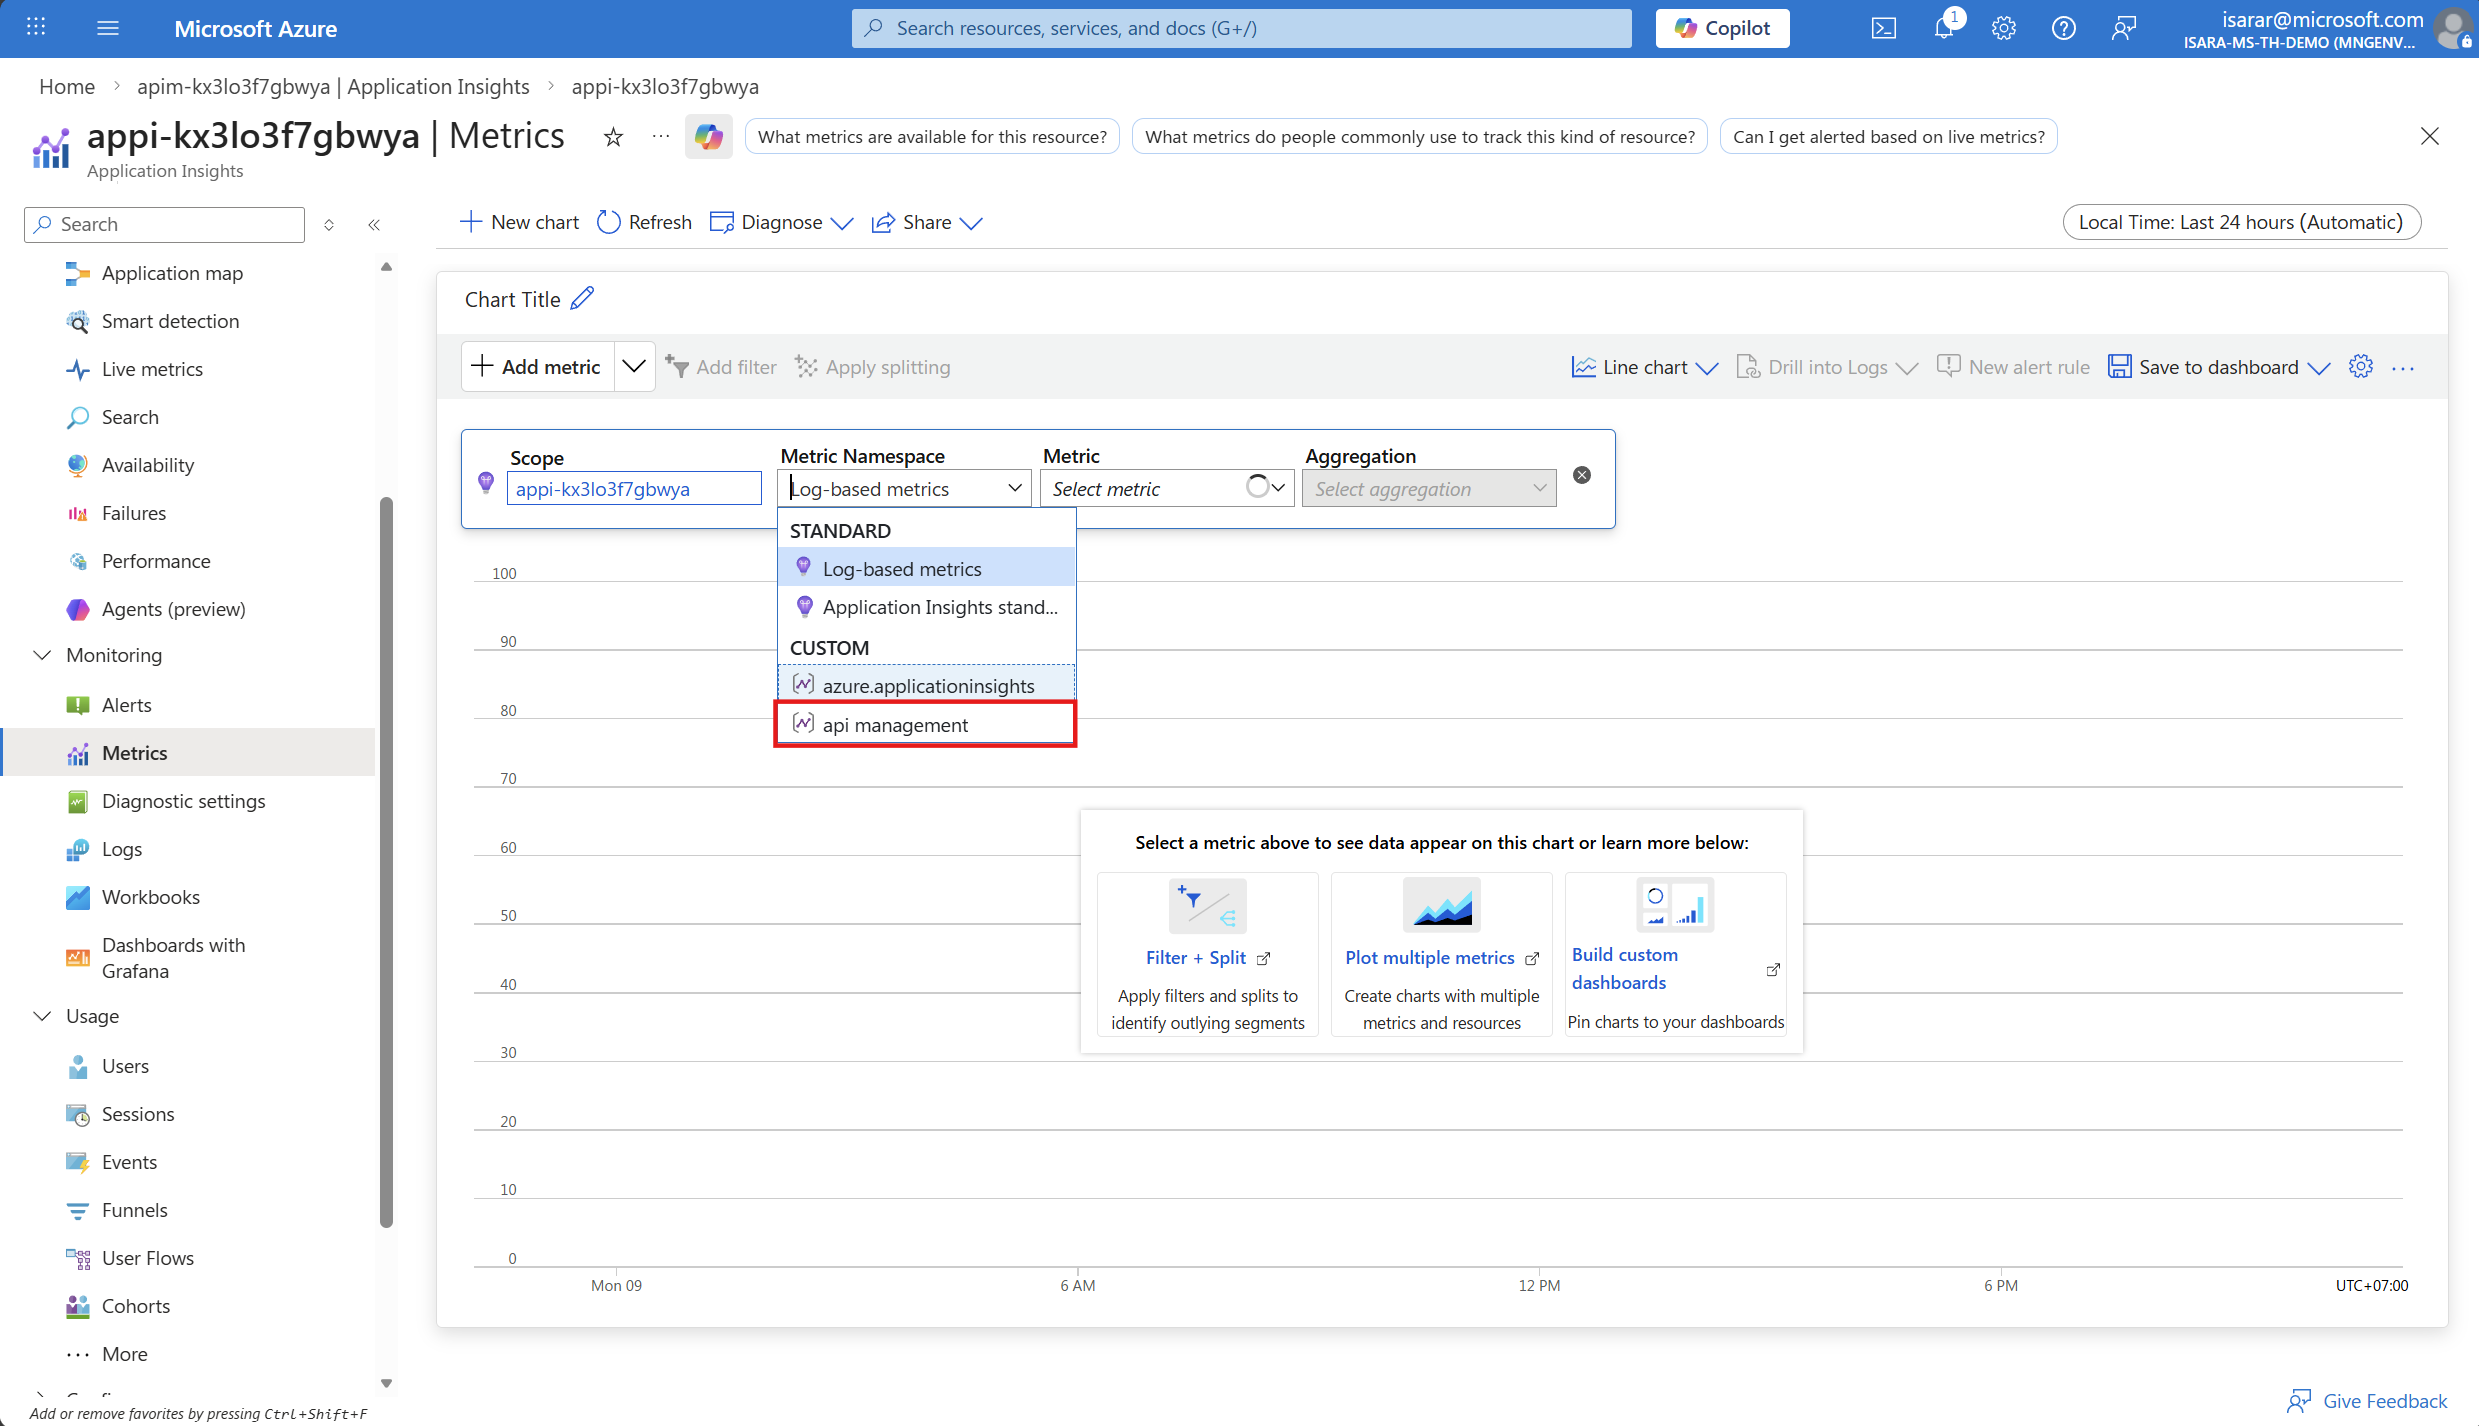
- In the metrics dashboard, configure the following:
- Scope: Your Application Insights instance (should be pre-selected)
- Metric Namespace: Select azure api management/service from the dropdown
- Metric: Add the following metrics one by one by selecting + Add metric:
- Prompt Tokens
- Completion Tokens
- Total Tokens
-
Adjust the time range to show recent data (e.g., Last 30 minutes or Last hour).
-
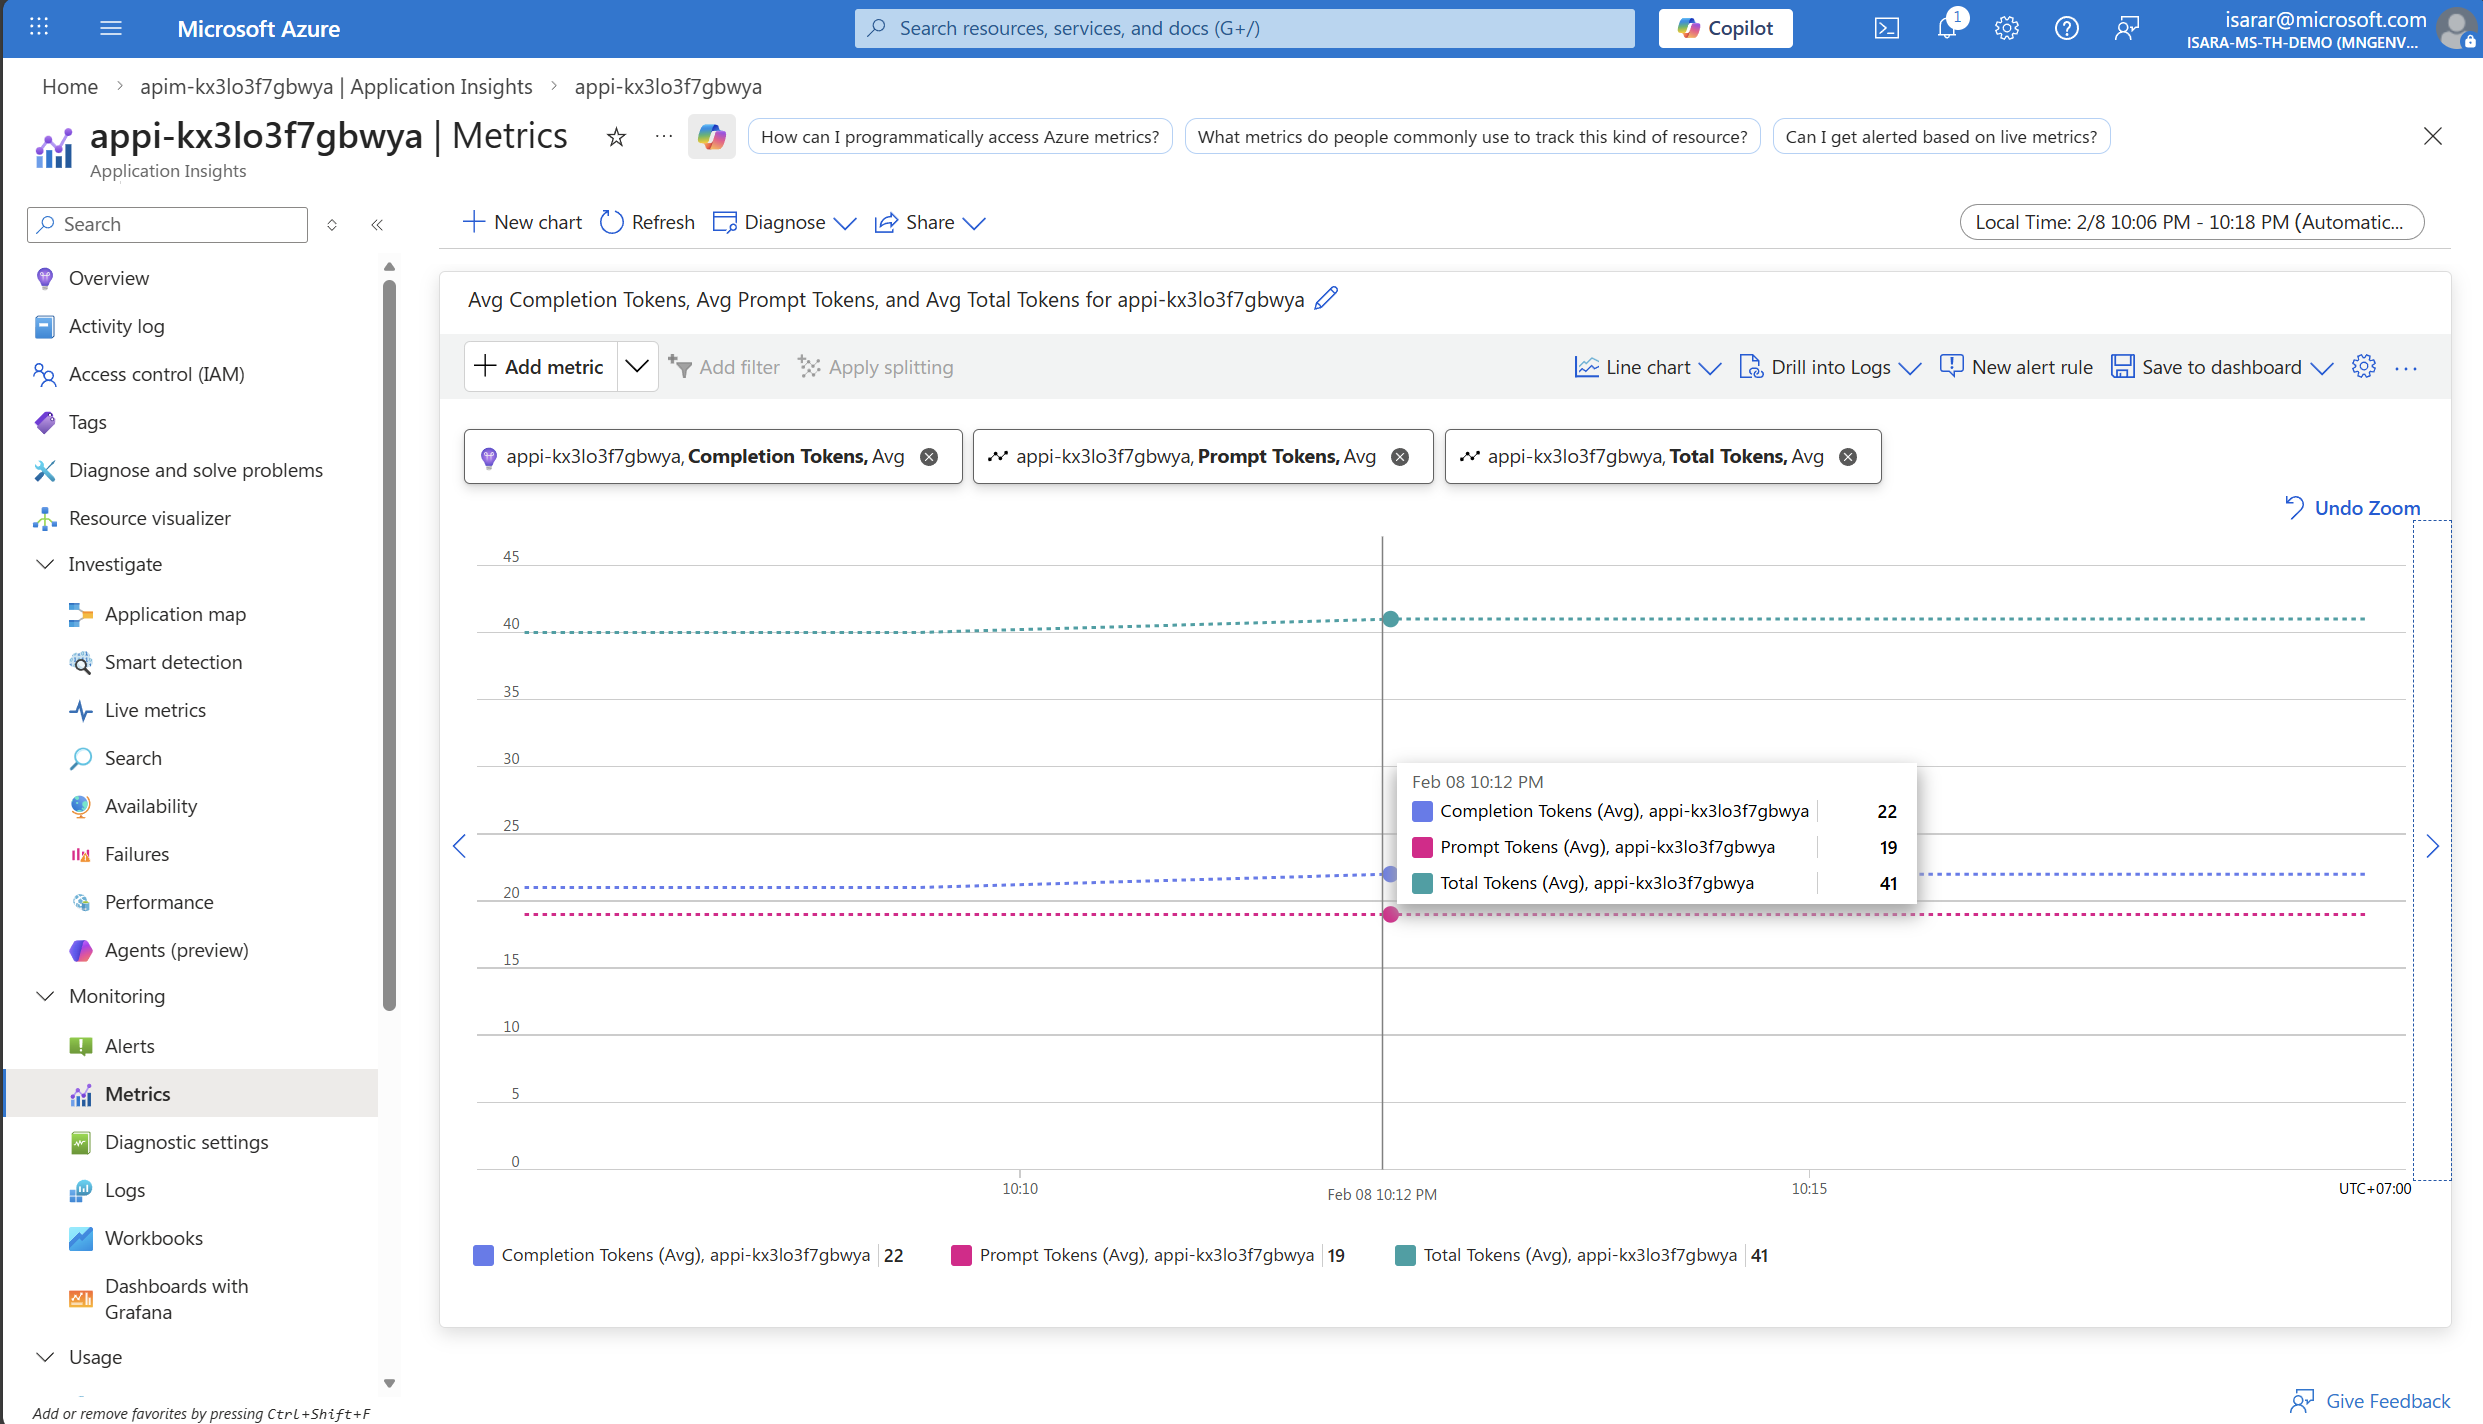
You should see a graph showing your token consumption across the test requests you made:
- Prompt Tokens: Number of tokens in your input messages
- Completion Tokens: Number of tokens in the AI-generated responses
- Total Tokens: Combined total
The metrics shown are aggregated values. You can change the aggregation type (Sum, Average, Max, etc.) and apply filters by dimensions like API ID or Deployment ID to drill down into specific usage patterns.
Understanding the Metrics
- Prompt Tokens: Represents the “input cost” - tokens you send to the model
- Completion Tokens: Represents the “output cost” - tokens the model generates
- Total Tokens: The sum of prompt and completion tokens, which determines your total API usage cost
By monitoring these metrics, you can:
- Identify cost drivers: Which applications or endpoints consume the most tokens
- Optimize prompts: Reduce unnecessary token usage by refining input messages
- Plan capacity: Forecast future usage and budget accordingly
- Ensure fairness: Distribute token quotas fairly across teams or applications
05: View token consumption metrics in APIM Log Analytics
In addition to Application Insights metrics, you can query detailed token consumption logs directly in API Management’s Log Analytics workspace for more granular analysis.
Expand this section to view the solution
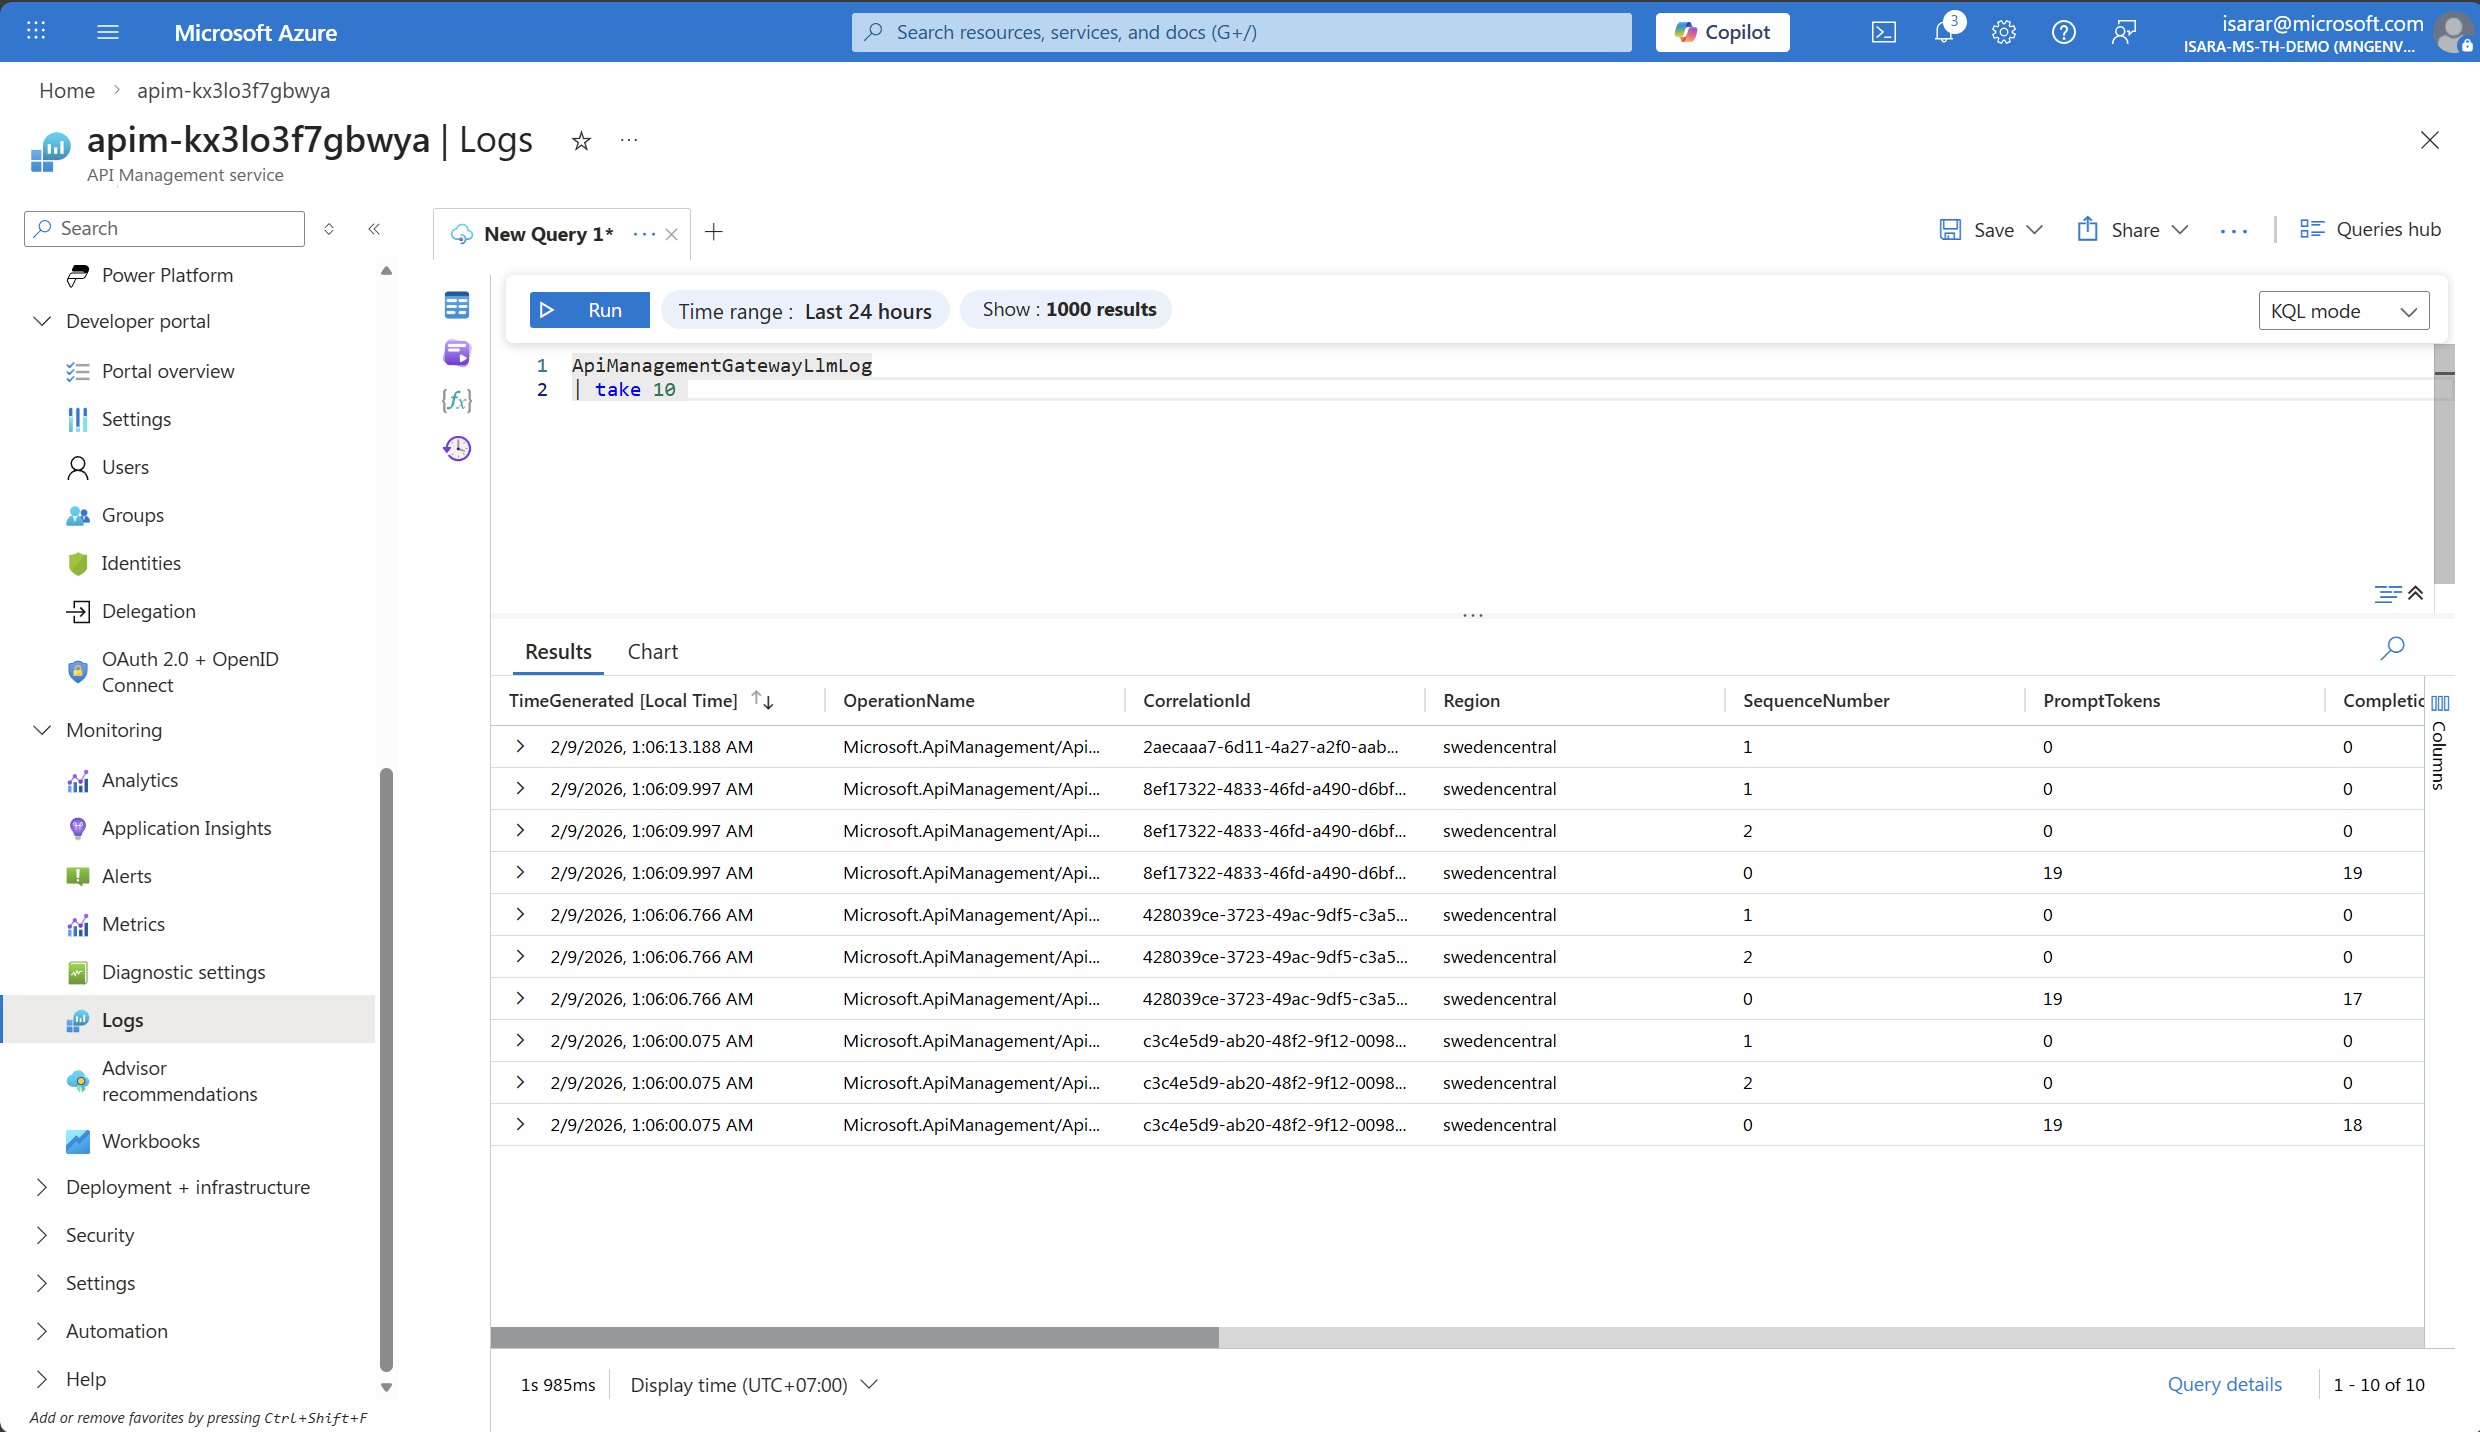
- In your API Management instance, navigate to Monitoring > Logs in the left menu.
-
Close the default queries popup if it appears.
-
In the query editor, enter the following KQL query to view token consumption:
ApiManagementGatewayLlmLog | take 10 -
Click Run to execute the query.
- You should see results showing:
- PromptTokens: Number of tokens in your input messages
- CompletionTokens: Number of tokens in the AI-generated responses
- TotalTokens: Combined total
- OperationName: The API operation called
- CorrelationId: Unique identifier for each request
- Region: The region where the request was processed
- SequenceNumber: The sequence of the request
-
Adjust the time range at the top of the page (e.g., Last 24 hours) to view data from your test period.
-
Optional: Create more advanced queries for analysis:
// View total token consumption by operation
ApiManagementGatewayLlmLog
| summarize TotalPromptTokens = sum(PromptTokens),
         TotalCompletionTokens = sum(CompletionTokens),
         TotalTokens = sum(TotalTokens),
         RequestCount = count()
// View token consumption over time (hourly) - render as timechart ApiManagementGatewayLlmLog | summarize AvgPromptTokens = avg(PromptTokens), AvgCompletionTokens = avg(CompletionTokens), TotalTokens = sum(TotalTokens) by bin(TimeGenerated, 5m) | order by TimeGenerated desc | render timechart// View individual requests with token details ApiManagementGatewayLlmLog | where SequenceNumber == 0 | project TimeGenerated, OperationName, PromptTokens, CompletionTokens, TotalTokens, CorrelationId | order by TimeGenerated desc | take 50 - Optional: Pin queries to a dashboard by clicking Pin to dashboard for ongoing monitoring.
to retrieve Azure OpenAI pricing data for your region. Azure OpenAPI pricing page
Alternatively, You can use the Azure Retail Prices API to calculate estimated costs based on your token consumption metrics
Log Analytics provides more flexibility than Application Insights metrics for detailed analysis, filtering, and correlation with other API Management logs. Use it when you need to investigate specific requests or analyze token consumption patterns in detail.